McDonalds 2015 Annual Report Download - page 18
Download and view the complete annual report
Please find page 18 of the 2015 McDonalds annual report below. You can navigate through the pages in the report by either clicking on the pages listed below, or by using the keyword search tool below to find specific information within the annual report.-
 1
1 -
2
-
3
-
4
-
5
-
6
-
7
-
 8
8 -
 9
9 -
 10
10 -
 11
11 -
 12
12 -
 13
13 -
 14
14 -
 15
15 -
 16
16 -
 17
17 -
 18
18 -
 19
19 -
 20
20 -
 21
21 -
 22
22 -
 23
23 -
 24
24 -
 25
25 -
 26
26 -
 27
27 -
 28
28 -
29
-
30
-
31
-
32
-
33
-
34
-
35
-
36
-
37
-
38
-
39
-
40
-
41
-
42
-
43
-
44
-
45
-
46
-
47
-
48
-
49
-
50
-
51
-
52
-
53
-
54
-
55
-
56
-
57
-
58
-
59
-
60
 |
 |

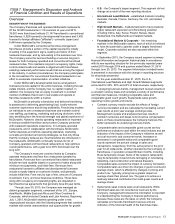
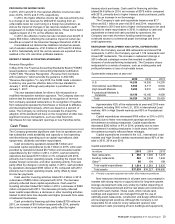
16 McDonald's Corporation 2015 Annual Report
Foundational Markets
The Foundational markets span over 80 countries across Asia,
Europe, Latin America, Middle East and Africa. This diverse group
of markets share common goals of enhancing the critical elements
that differentiate McDonald’s - the menu and the customer
experience. Menu efforts include emphasizing core favorites and
ensuring strong everyday value platforms are in place,
complemented by exciting new menu news tailored to local tastes
and flavor preferences. The markets are placing a renewed
commitment on running great restaurants and increasing
convenience to customers, including drive-thru and delivery.
The segment is pursuing refranchising opportunities, including
the sale of certain markets to developmental licensees.
McDonald's is also exploring the sale of a portion of the
Company’s ownership in McDonald’s Japan to a strategic investor
who could help advance Japan’s turnaround efforts, unlock the
market’s growth potential, and enhance value for all stakeholders.
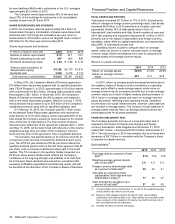
OUTLOOK FOR 2016
As McDonald's continues to execute its turnaround plan in 2016,
the Company is confident that these strategies will transform
customer perceptions of McDonald's as a modern and progressive
burger company delivering a contemporary experience.
Although some larger markets face challenging headwinds as
the Company enters 2016, McDonald's expects continued positive
top-line momentum across all segments. McDonald's System is
committed to elevating every aspect of the customer experience
with the essential imperative of running great restaurants.
While the Company does not provide specific guidance on
earnings per share, the following global and certain segment-
specific information is provided to assist in forecasting the
Company’s future results.
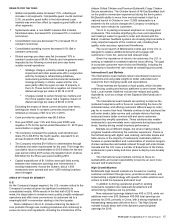
• Changes in Systemwide sales are driven by
comparable sales and net restaurant unit expansion.
The Company expects net restaurant additions to add
approximately 1 percentage point to 2016 Systemwide
sales growth (in constant currencies).
• The Company does not generally provide specific
guidance on changes in comparable sales. However,
as a perspective, assuming no change in cost
structure, a 1 percentage point change in comparable
sales for either the U.S. or the International Lead
Markets segment would change annual diluted
earnings per share by about 4 cents.
• With about 75% of McDonald's grocery bill comprised
of 10 different commodities, a basket of goods
approach is the most comprehensive way to look at
the Company's commodity costs. For the full-year
2016, costs for the total basket of goods are expected
to decrease about 1-2% in the U.S. and remain
relatively flat in the International Lead Markets
segment.
• The Company expects full-year 2016 selling, general
and administrative expenses to decrease about 1-2%
in constant currencies, with fluctuations expected
between the quarters. This includes expenses
associated with our Worldwide Owner/Operator
Convention in second quarter 2016 and sponsorship
of the Summer Olympic games in third quarter 2016.
• Based on current interest and foreign currency
exchange rates, the Company expects interest
expense for the full-year 2016 to increase about
40-45% compared with 2015 due to higher average
debt balances.
• A significant part of the Company's operating income
is generated outside the U.S., and about 30% of its
total debt is denominated in foreign currencies.
Accordingly, earnings are affected by changes in
foreign currency exchange rates, particularly the Euro,
British Pound, Australian Dollar and Canadian Dollar.
Collectively, these currencies represent approximately
70% of the Company's operating income outside the
U.S. If all four of these currencies moved by 10% in
the same direction, the Company's annual diluted
earnings per share would change by up to 25 cents.
• The Company expects the effective income tax rate
for the full-year 2016 to be in the 31%-33% range.
Some volatility may be experienced between the
quarters resulting in a quarterly tax rate outside of the
annual range.
• The Company expects capital expenditures for 2016
to be approximately $2.0 billion, about half of which
will be used to open new restaurants. The Company
expects to open about 1,000 restaurants, including
about 400 restaurants in affiliated and developmental-
licensee markets where the Company does not fund
any capital expenditures. The Company expects net
additions of about 500 restaurants. The remaining
capital will be used to reinvest in existing locations,
including about 400 to 500 reimages in the U.S.
• The Company plans to optimize its capital structure
and expects to return about $30 billion to shareholders
for the three-year period ending 2016. The cumulative
return for the two years ended 2015 was nearly $16
billion, leaving about $14 billion to be completed in
2016. Some of this remaining amount will be funded
by issuing additional debt, of which approximately $6
billion was issued in the fourth quarter 2015.
Long-term
• The Company expects to refranchise about 4,000
restaurants in the four-year period ending 2018 with a
long-term goal to become 95% franchised. The
majority of the refranchising will take place in the High
Growth and Foundational markets. During 2015, we
refranchised about 470 restaurants.
• The Company expects to realize net annual G&A
savings of about $500 million from our G&A base of
$2.6 billion at the beginning of 2015, the vast majority
of which is expected to be realized by the end of 2017.
These savings will be realized through our
refranchising efforts, streamlining resources across
corporate, segment and market organizations,
primarily in non-customer facing functions, and
realizing greater efficiencies in the Company's Global
Business Services platform. This target excludes the
impact of foreign currency changes. We expect to
realize a cumulative total of about $150 million in
savings by the end of 2016, with about half of these
savings already achieved in 2015.
• In connection with executing against our refranchising
and G&A targets, we may incur incremental strategic
charges associated with asset dispositions and
restructuring.