McDonalds 2015 Annual Report Download - page 40
Download and view the complete annual report
Please find page 40 of the 2015 McDonalds annual report below. You can navigate through the pages in the report by either clicking on the pages listed below, or by using the keyword search tool below to find specific information within the annual report.-
 1
1 -
2
-
3
-
4
-
5
-
6
-
7
-
8
-
9
-
10
-
11
-
12
-
13
-
14
-
15
-
16
-
17
-
18
-
19
-
20
-
21
-
22
-
23
-
24
-
25
-
26
-
27
-
28
-
29
-
 30
30 -
 31
31 -
 32
32 -
 33
33 -
 34
34 -
 35
35 -
 36
36 -
 37
37 -
 38
38 -
 39
39 -
 40
40 -
 41
41 -
 42
42 -
 43
43 -
 44
44 -
 45
45 -
 46
46 -
 47
47 -
 48
48 -
 49
49 -
 50
50 -
51
-
52
-
53
-
54
-
55
-
56
-
57
-
58
-
59
-
60
 |
 |

38 McDonald's Corporation 2015 Annual Report
The following table presents the fair values of derivative instruments included on the Consolidated balance sheet as of December 31,
2015 and 2014:
Derivative Assets Derivative Liabilities
In millions Balance Sheet Classification 2015 2014 Balance Sheet Classification 2015 2014
Derivatives designated as hedging instruments
Foreign currency Prepaid expenses and other
current assets $55.0 $80.5
Accrued payroll and other
liabilities $(22.5) $(0.2)
Interest rate Prepaid expenses and other
current assets 0.0 2.6
Foreign currency Miscellaneous other assets 0.6 15.5 Other long-term liabilities (13.0) (34.6)
Interest rate Miscellaneous other assets 5.3 9.6 Other long-term liabilities (3.4) (7.5)
Total derivatives designated as hedging instruments $ 60.9 $108.2 $(38.9) $(42.3)
Derivatives not designated as hedging instruments
Equity Prepaid expenses and other
current assets $0.3$ 120.6
Foreign currency Prepaid expenses and other
current assets 4.2 17.3
Accrued payroll and other
liabilities $(5.5)$(7.9)
Equity Miscellaneous other assets 139.9 0.0
Total derivatives not designated as hedging instruments $ 144.4 $ 137.9 $(5.5)$(7.9)
Total derivatives $ 205.3 $ 246.1 $(44.4) $(50.2)
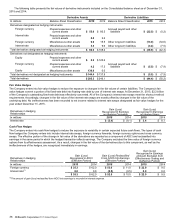
Fair Value Hedges
The Company enters into fair value hedges to reduce the exposure to changes in the fair values of certain liabilities. The Company's fair
value hedges convert a portion of its fixed-rate debt into floating-rate debt by use of interest rate swaps. At December 31, 2015, $2.2 billion
of the Company's outstanding fixed-rate debt was effectively converted. All of the Company’s interest rate swaps meet the shortcut method
requirements. Accordingly, changes in the fair value of the interest rate swaps are exactly offset by changes in the fair value of the
underlying debt. No ineffectiveness has been recorded to net income related to interest rate swaps designated as fair value hedges for the
year ended December 31, 2015.
Derivatives in Hedging
Relationships
Gain (Loss)
Recognized In Earnings
on Hedging Derivative
Gain (Loss)
Recognized In Earnings
on Hedged Items
In millions 2015 2014 2015 2014
Interest rate $(3.4) $(8.1) $3.4 $8.1
Cash Flow Hedges
The Company enters into cash flow hedges to reduce the exposure to variability in certain expected future cash flows. The types of cash
flow hedges the Company enters into include interest rate swaps, foreign currency forwards, foreign currency options and cross currency
swaps. The effective portion of the change in fair value of the derivatives are reported as a component of AOCI and reclassified into
earnings in the same period in which the hedged transaction affects earnings. The Company excludes the time value of foreign currency
options from its effectiveness assessment. As a result, changes in the fair value of the derivatives due to this component, as well as the
ineffectiveness of the hedges, are recognized immediately in earnings.
Gain (Loss)
Recognized in AOCI
(Effective Portion)
Gain (Loss) Reclassified
From AOCI Into Earnings
(Effective Portion)
Gain (Loss)
Recognized in Earnings
(Amount Excluded from
Effectiveness Testing and
Ineffective Portion)
Derivatives in Hedging
Relationships
In millions 2015 2014 2015 2014 2015 2014
Foreign currency $ 35.3 $62.0 $ 53.0 $11.0 $22.9 $9.5
Interest rate(1) 0.0 0.0 (0.5) (0.5) 0.0 0.0
$ 35.3 $62.0 $52.5 $10.5 $22.9 $9.5
(1)The amount of gain (loss) reclassified from AOCI into earnings is recorded in interest expense.