McDonalds 2015 Annual Report Download - page 20
Download and view the complete annual report
Please find page 20 of the 2015 McDonalds annual report below. You can navigate through the pages in the report by either clicking on the pages listed below, or by using the keyword search tool below to find specific information within the annual report.-
 1
1 -
2
-
3
-
4
-
5
-
6
-
7
-
8
-
9
-
 10
10 -
 11
11 -
 12
12 -
 13
13 -
 14
14 -
 15
15 -
 16
16 -
 17
17 -
 18
18 -
 19
19 -
 20
20 -
 21
21 -
 22
22 -
 23
23 -
 24
24 -
 25
25 -
 26
26 -
 27
27 -
 28
28 -
 29
29 -
 30
30 -
31
-
32
-
33
-
34
-
35
-
36
-
37
-
38
-
39
-
40
-
41
-
42
-
43
-
44
-
45
-
46
-
47
-
48
-
49
-
50
-
51
-
52
-
53
-
54
-
55
-
56
-
57
-
58
-
59
-
60
 |
 |

18 McDonald's Corporation 2015 Annual Report
• $0.23 per share due to the estimated impact of a supplier
issue in China. As a consequence, results in China,
Japan and certain other markets were negatively
impacted due to lost sales and profitability, including
expenses associated with customer recovery efforts.
Excluding the impact of these current and prior year items, in
2015 earnings per share in constant currencies would have
reflected an increase of $0.12 or 2%. In 2014, diluted earnings per
share would have reflected a decrease of 3% (1% in constant
currencies) excluding the 2014 charges related to certain foreign
tax matters and the China supplier issue. This supplemental
information is provided to assist investors in understanding the
impact of significant items outside of normal operations.
The Company repurchased 61.8 million shares of its stock for
$6.2 billion in 2015 and 33.1 million shares of its stock for $3.2
billion in 2014, driving reductions in weighted-average shares
outstanding on a diluted basis in both periods, which positively
benefited earnings per share.
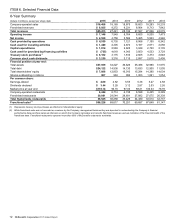
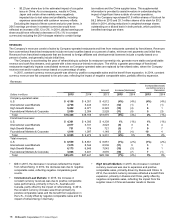
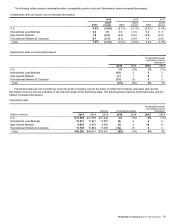
REVENUES
The Company’s revenues consist of sales by Company-operated restaurants and fees from restaurants operated by franchisees. Revenues
from conventional franchised restaurants include rent and royalties based on a percent of sales, minimum rent payments and initial fees.
Revenues from franchised restaurants that are licensed to foreign affiliates and developmental licensees include a royalty based on a
percent of sales, and generally include initial fees.
The Company is accelerating the pace of refranchising to optimize its restaurant ownership mix, generate more stable and predictable
revenue and cash flow streams, and operate with a less resource-intensive structure. The shift to a greater percentage of franchised
restaurants negatively impacts consolidated revenues as Company-operated sales are replaced by franchised sales, where the Company
receives rent and/or royalty revenue based on a percentage of sales.
In 2015, constant currency revenue growth was driven by positive comparable sales and the benefit from expansion. In 2014, constant
currency revenue was flat compared to the prior year, reflecting the impact of negative comparable sales, partially offset by expansion.
Revenues
Amount Increase/(decrease)
Increase/(decrease)
excluding currency
translation
Dollars in millions 2015 2014 2013 2015 2014 2015 2014
Company-operated sales:
U.S. $ 4,198 $ 4,351 $ 4,512 (4%) (4%) (4%) (4%)
International Lead Markets 4,798 5,443 5,513 (12) (1) 1(1)
High Growth Markets 5,442 6,071 6,322 (10) (4) 61
Foundational Markets & Corporate 2,050 2,304 2,528 (11) (9) 5(3)
Total $16,488 $18,169 $18,875 (9%) (4%) 2% (1%)
Franchised revenues:
U.S. $ 4,361 $ 4,300 $ 4,339 1% (1%) 1% (1%)
International Lead Markets 2,817 3,101 3,023 (9) 364
High Growth Markets 731 774 721 (5) 797
Foundational Markets & Corporate 1,016 1,097 1,148 (7) (4) 10 4
Total $ 8,925 $ 9,272 $ 9,231 (4%) 0% 5% 2%
Total revenues:
U.S. $ 8,559 $8,651 $8,851 (1%) (2%) (1%) (2%)
International Lead Markets 7,615 8,544 8,536 (11) 031
High Growth Markets 6,173 6,845 7,043 (10) (3) 61
Foundational Markets & Corporate 3,066 3,401 3,676 (10) (7) 7(1)
Total $25,413 $27,441 $28,106 (7%) (2%) 3% 0%
• US: In 2015, the decrease in revenues reflected the impact
from refranchising. In 2014, the decrease was due to negative
comparable sales, reflecting negative comparable guest
counts.
• International Lead Markets: In 2015, the increase in
constant currency revenues was due to positive comparable
sales performance, primarily in the U.K., Australia and
Canada, partly offset by the impact of refranchising. In 2014,
the constant currency increase was driven primarily by
positive comparable sales and the benefit from expansion in
the U.K., mostly offset by negative comparable sales and the
impact of refranchising in Germany.
• High Growth Markets: In 2015, the increase in constant
currency revenues was due to expansion and positive
comparable sales, primarily driven by Russia and China. In
2014, the constant currency increase reflected a benefit from
expansion, primarily in Russia and China, partly offset by
negative comparable sales, reflecting the impact from the
supplier issue in China and weaker results in Russia.