McDonalds 2015 Annual Report Download - page 15
Download and view the complete annual report
Please find page 15 of the 2015 McDonalds annual report below. You can navigate through the pages in the report by either clicking on the pages listed below, or by using the keyword search tool below to find specific information within the annual report.-
 1
1 -
2
-
3
-
4
-
 5
5 -
 6
6 -
 7
7 -
 8
8 -
 9
9 -
 10
10 -
 11
11 -
 12
12 -
 13
13 -
 14
14 -
 15
15 -
 16
16 -
 17
17 -
 18
18 -
 19
19 -
 20
20 -
 21
21 -
 22
22 -
 23
23 -
 24
24 -
 25
25 -
26
-
27
-
28
-
29
-
30
-
31
-
32
-
33
-
34
-
35
-
36
-
37
-
38
-
39
-
40
-
41
-
42
-
43
-
44
-
45
-
46
-
47
-
48
-
49
-
50
-
51
-
52
-
53
-
54
-
55
-
56
-
57
-
58
-
59
-
60
 |
 |

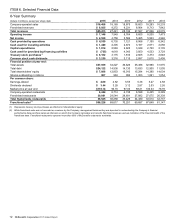
McDonald's Corporation 2015 Annual Report 13
ITEM 7. Management’s Discussion and Analysis
of Financial Condition and Results of Operations
Overview
DESCRIPTION OF THE BUSINESS
The Company franchises and operates McDonald’s restaurants.
Of the 36,525 restaurants in 119 countries at year-end 2015,
30,081 were franchised (reflects 21,147 franchised to conventional
franchisees, 5,529 licensed to developmental licensees and 3,405
licensed to foreign affiliates ("affiliates")—primarily Japan) and
6,444 were operated by the Company.
Under McDonald's conventional franchise arrangement,
franchisees provide a portion of the capital required by initially
investing in the equipment, signs, seating and décor of their
restaurant business, and by reinvesting in the business over time.
The Company owns the land and building or secures long-term
leases for both Company-operated and conventional franchised
restaurant sites. This maintains long-term occupancy rights, helps
control related costs and assists in alignment with franchisees
enabling restaurant performance levels that are among the highest
in the industry. In certain circumstances, the Company participates
in the reinvestment for conventional franchised restaurants in an
effort to accelerate implementation of certain initiatives.
Under McDonald's developmental license arrangement,
licensees provide capital for the entire business, including the real
estate interest, and the Company has no capital invested. In
addition, the Company has an equity investment in a limited
number of affiliates that invest in real estate and operate or
franchise restaurants within a market.
McDonald's is primarily a franchisor and believes franchising
is paramount to delivering great-tasting food, locally-relevant
customer experiences and driving profitability. Franchising enables
an individual to own a restaurant business and maintain control
over staffing, purchasing, marketing and pricing decisions, while
also benefiting from the financial strength and global experience of
McDonald's. However, directly operating restaurants is important
to being a credible franchisor and provides Company personnel
with restaurant operations experience. In Company-operated
restaurants, and in collaboration with franchisees, McDonald's
further develops and refines operating standards, marketing
concepts and product and pricing strategies, so that only those
that the Company believes are most beneficial are introduced in
the restaurants. McDonald's continually reviews its mix of
Company-operated and franchised restaurants to help optimize
overall performance, with a goal to be 95% franchised over the
long term.
The Company’s revenues consist of sales by Company-
operated restaurants and fees from restaurants operated by
franchisees. Revenues from conventional franchised restaurants
include rent and royalties based on a percent of sales along with
minimum rent payments, and initial fees. Revenues from
restaurants licensed to affiliates and developmental licensees
include a royalty based on a percent of sales, and generally
include initial fees. Fees vary by type of site, amount of Company
investment, if any, and local business conditions. These fees,
along with occupancy and operating rights, are stipulated in
franchise/license agreements that generally have 20-year terms.
Through June 30, 2015, the Company was managed as
distinct geographic segments, comprised of the U.S., Europe,
Asia/Pacific, Middle East and Africa and Other Countries &
Corporate, which included Canada and Latin America. Beginning
July 1, 2015, McDonald’s started operating under a new
organizational structure with the following segments that combine
markets with similar characteristics and opportunities for growth:
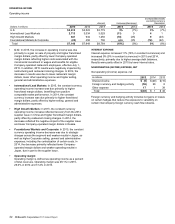
• U.S. - the Company's largest segment. This segment did not
change as a result of the new reporting structure.
• International Lead Markets - established markets including
Australia, Canada, France, Germany, the U.K. and related
markets.
• High Growth Markets - markets believed to have relatively
higher restaurant expansion and franchising potential
including China, Italy, Korea, Poland, Russia, Spain,
Switzerland, the Netherlands and related markets.
• Foundational Markets & Corporate - the remaining
markets in the McDonald's system, each of which is believed
to have the potential to operate under a largely franchised
model. Corporate activities are also reported within this
segment.
In September 2015, the Company issued segment summary
financial information and segment historical data in accordance
with its new reporting structure for the previously reported years
ended 2010 through 2014 and quarters ended March 31, 2014
through June 30, 2015. The segment information included herein
is presented in accordance with the change in reporting structure
for all periods presented.
For the year ended December 31, 2015, the U.S.,
International Lead Markets and High Growth Markets segments
accounted for 34%, 30% and 24% of total revenues, respectively.
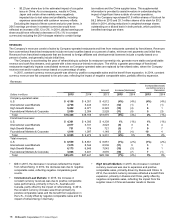
In analyzing business trends, management reviews results on
a constant currency basis and considers a variety of performance
and financial measures, including comparable sales and
comparable guest count growth, Systemwide sales growth,
operating income growth and returns.
Constant currency results exclude the effects of foreign
currency translation and are calculated by translating current
year results at prior year average exchange rates.
Management reviews and analyzes business results in
constant currencies and bases most incentive compensation
plans on these results because the Company believes this
better represents its underlying business trends.
Comparable sales and comparable guest counts are key
performance indicators used within the retail industry and are
indicative of the impact of the Company’s initiatives as well
as local economic and consumer trends. Increases or
decreases in comparable sales and comparable guest
counts represent the percent change in sales and
transactions, respectively, from the same period in the prior
year for all restaurants, whether operated by the Company or
franchisees, in operation at least thirteen months, including
those temporarily closed. Some of the reasons restaurants
may be temporarily closed include reimaging or remodeling,
rebuilding, road construction and natural disasters.
Comparable sales exclude the impact of currency translation.
Comparable sales are driven by changes in guest counts and
average check, which is affected by changes in pricing and
product mix. Typically, pricing has a greater impact on
average check than product mix. The goal is to achieve a
relatively balanced contribution from both guest counts and
average check.
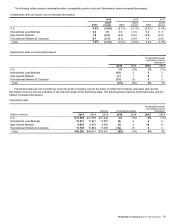
Systemwide sales include sales at all restaurants. While
franchised sales are not recorded as revenues by the
Company, management believes the information is important
in understanding the Company’s financial performance
because these sales are the basis on which the Company
calculates and records franchised revenues and are
indicative of the financial health of the franchisee base.