McDonalds 2015 Annual Report Download - page 24
Download and view the complete annual report
Please find page 24 of the 2015 McDonalds annual report below. You can navigate through the pages in the report by either clicking on the pages listed below, or by using the keyword search tool below to find specific information within the annual report.-
 1
1 -
2
-
3
-
4
-
5
-
6
-
7
-
8
-
9
-
10
-
11
-
12
-
13
-
 14
14 -
 15
15 -
 16
16 -
 17
17 -
 18
18 -
 19
19 -
 20
20 -
 21
21 -
 22
22 -
 23
23 -
 24
24 -
 25
25 -
 26
26 -
 27
27 -
 28
28 -
 29
29 -
 30
30 -
 31
31 -
 32
32 -
 33
33 -
 34
34 -
35
-
36
-
37
-
38
-
39
-
40
-
41
-
42
-
43
-
44
-
45
-
46
-
47
-
48
-
49
-
50
-
51
-
52
-
53
-
54
-
55
-
56
-
57
-
58
-
59
-
60
 |
 |

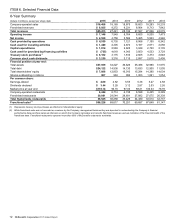
22 McDonald's Corporation 2015 Annual Report
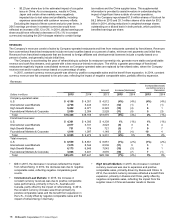
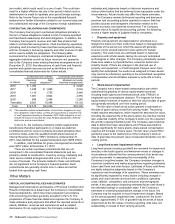
OPERATING INCOME
Operating income
Amount Increase/(decrease)
Increase/(decrease)
excluding currency
translation
Dollars in millions 2015 2014 2013 2015 2014 2015 2014
U.S. $3,612 $3,523 $3,779 3% (7%) 3% (7%)
International Lead Markets 2,713 3,034 3,029 (11) 041
High Growth Markets 841 934 1,250 (10) (25) 9(23)
Foundational Markets & Corporate (20) 458 706 n/m (35) (74) (22)
Total $7,146 $7,949 $8,764 (10%) (9%) 0% (8%)
• U.S.: In 2015, the increase in operating income was due
primarily to a gain on sale of property and higher franchised
margin dollars, partly offset by lower Company-operated
margin dollars reflecting higher costs associated with the
incremental investment in wages and benefits for eligible
Company-operated restaurant employees, effective July 1,
2015. In addition, 2015 results were negatively impacted by
restructuring and restaurant closing charges. In 2014, the
decrease in results was due to lower restaurant margin
dollars, lower other operating income and higher selling,
general and administrative expenses.
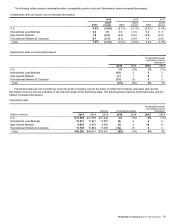
• International Lead Markets: In 2015, the constant currency
operating income increase was due primarily to higher
franchised margin dollars, benefiting from positive
comparable sales performance. In 2014, the constant
currency increase was due primarily to higher franchised
margin dollars, partly offset by higher selling, general and
administrative expenses.
• High Growth Markets: In 2015, the constant currency
operating income increase reflected recovery from the 2014
supplier issue in China and higher franchised margin dollars,
partly offset by restaurant closing charges. In 2014, the
decrease reflected the negative impact of the supplier issue
and lower Company-operated margin dollars in Russia.
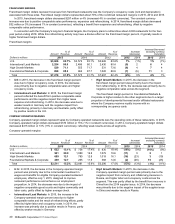
• Foundational Markets and Corporate: In 2015, the constant
currency operating income decrease was due to strategic
charges across the segment and weaker results in Japan, as
well as higher Corporate selling, general and administrative
expenses, including the centralization of certain costs. In
2014, the decrease primarily reflected lower Company-
operated margin dollars and weaker operating results in
Japan, due in part to the supplier issue.
• Operating margin
Operating margin is defined as operating income as a percent
of total revenues. Operating margin was 28.1% in 2015,
29.0% in 2014 and 31.2% in 2013.
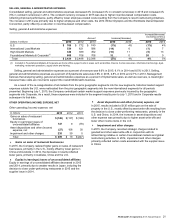
INTEREST EXPENSE
Interest expense increased 11% (16% in constant currencies) and
increased 9% (9% in constant currencies) in 2015 and 2014,
respectively, primarily due to higher average debt balances.
Results were partly offset in 2015 by lower interest rates.
NONOPERATING (INCOME) EXPENSE, NET
Nonoperating (income) expense, net
In millions 2015 2014 2013
Interest income $(9) $(20) $(15)
Foreign currency and hedging activity (56) 20 8
Other expense 17 139
Total $(48) $1 $32
Foreign currency and hedging activity includes net gains or losses
on certain hedges that reduce the exposure to variability on
certain intercompany foreign currency cash flow streams.