McDonalds 2015 Annual Report Download - page 26
Download and view the complete annual report
Please find page 26 of the 2015 McDonalds annual report below. You can navigate through the pages in the report by either clicking on the pages listed below, or by using the keyword search tool below to find specific information within the annual report.-
 1
1 -
2
-
3
-
4
-
5
-
6
-
7
-
8
-
9
-
10
-
11
-
12
-
13
-
14
-
15
-
 16
16 -
 17
17 -
 18
18 -
 19
19 -
 20
20 -
 21
21 -
 22
22 -
 23
23 -
 24
24 -
 25
25 -
 26
26 -
 27
27 -
 28
28 -
 29
29 -
 30
30 -
 31
31 -
 32
32 -
 33
33 -
 34
34 -
 35
35 -
 36
36 -
37
-
38
-
39
-
40
-
41
-
42
-
43
-
44
-
45
-
46
-
47
-
48
-
49
-
50
-
51
-
52
-
53
-
54
-
55
-
56
-
57
-
58
-
59
-
60
 |
 |

24 McDonald's Corporation 2015 Annual Report
for new traditional McDonald’s restaurants in the U.S. averaged
approximately $3.3 million in 2015.
The Company owned approximately 45% of the land and
about 70% of the buildings for restaurants in its consolidated
markets at year-end 2015 and 2014.
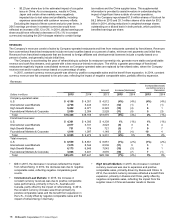
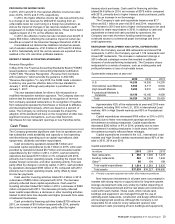
SHARE REPURCHASES AND DIVIDENDS
In 2015, the Company returned approximately $9.4 billion to
shareholders through a combination of shares repurchased and
dividends paid. This brings the cumulative two-year return to
shareholders to $15.8 billion versus our targeted return of about
$30 billion for the three-year period ending 2016.
Shares repurchased and dividends
In millions, except per share data 2015 2014 2013
Number of shares repurchased 61.8 33.1 18.7
Shares outstanding at year end 907 963 990
Dividends declared per share $3.44 $ 3.28 $ 3.12
Treasury stock purchases (in
Shareholders' equity) $6,182 $3,175 $1,810
Dividends paid 3,230 3,216 3,115
Total returned to shareholders $9,412 $6,391 $4,925
In May 2014, the Company’s Board of Directors approved a
$10 billion share repurchase program with no specified expiration
date ("2014 Program"). In 2015, approximately 61.8 million shares
were repurchased for $6.2 billion, bringing total purchases under
the program to $8.1 billion. In December 2015, the Company's
Board of Directors terminated the 2014 program and replaced it
with a new share repurchase program, effective January 1, 2016,
that authorizes the purchase of up to $15 billion of the Company's
outstanding common stock with no specified expiration date.
On February 12, 2016, the Company paid $2.7 billion under
an Accelerated Share Repurchase agreement and received an
initial delivery of 18.5 million shares, which represents 80% of the
total shares the Company expects to receive based on the market
price at the time of initial delivery. The final number of shares
delivered upon settlement of the agreement, between April 1, 2016
and May 13, 2016, will be determined with reference to the volume
weighted average price per share of the Company’s common
stock over the term of the agreement, less a negotiated discount.
The Company has paid dividends on its common stock for 40
consecutive years and has increased the dividend amount every
year. The 2015 full year dividend of $3.44 per share reflects the
quarterly dividend paid for each of the first three quarters of $0.85
per share, with an increase to $0.89 per share paid in the fourth
quarter. This 5% increase in the quarterly dividend equates to a
$3.56 per share annual dividend and reflects the Company’s
confidence in the ongoing strength and reliability of its cash flow.
As in the past, future dividend amounts will be considered after
reviewing profitability expectations and financing needs, and will
be declared at the discretion of the Company’s Board of Directors.
Financial Position and Capital Resources
TOTAL ASSETS AND RETURNS
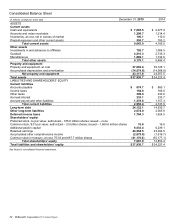
Total assets increased $3.7 billion or 11% in 2015. Excluding the
effect of changes in foreign currency exchange rates, total assets
increased $5.8 billion in 2015 primarily due to higher cash and
equivalents. Nearly 75% of total assets were in the U.S.,
International Lead markets and High Growth markets at year-end
2015. Net property and equipment decreased $1.4 billion in 2015,
primarily due to the impact of depreciation and foreign currency
translation, partly offset by capital expenditures, and represented
about 60% of total assets at year end.
Operating income is used to compute return on average
assets, while net income is used to calculate return on average
common equity. Month-end balances are used to compute both
average assets and average common equity.
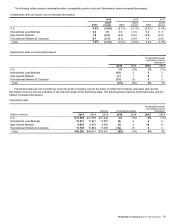
Returns on assets and equity
2015 2014 2013
Return on average assets 20.9% 21.8% 24.8%
Return on average common
equity 45.1 31.3 35.8
In 2015, return on average assets decreased primarily due to
the negative impact of foreign currency translation on operating
income, partly offset by lower average assets, while return on
average common equity increased primarily due to lower average
common equity as a result of higher treasury stock purchases. In
2014, return on average assets and return on average common
equity decreased, reflecting lower operating results. Operating
income does not include interest income; however, cash balances
are included in average assets. The inclusion of cash balances in
average assets reduced return on average assets by about two
percentage points for all years presented.
FINANCING AND MARKET RISK
The Company generally borrows on a long-term basis and is
exposed to the impact of interest rate changes and foreign
currency fluctuations. Debt obligations at December 31, 2015
totaled $24.1 billion, compared with $15.0 billion at December 31,
2014. The net increase in 2015 was primarily due to net long-term
issuances of $9.7 billion in connection with the Company's plans
to optimize its capital structure.
Debt highlights(1)
2015 2014 2013
Fixed-rate debt as a percent of total
debt(2,3) 81% 74% 74%
Weighted-average annual interest
rate of total debt(3) 3.8 4.0 4.0
Foreign currency-denominated debt
as a percent of total debt(2) 29 40 41
Total debt as a percent of total
capitalization (total debt and total
Shareholders' equity)(2) 77 54 47
Cash provided by operations as a
percent of total debt(2) 27 45 50
(1) All percentages are as of December 31, except for the weighted-average
annual interest rate, which is for the year.
(2) Based on debt obligations before the effects of fair value hedging
adjustments and deferred debt costs. These effects are excluded as they
have no impact on the obligation at maturity. See Debt financing note to
the consolidated financial statements.
(3) Includes the effect of interest rate swaps.