Microsoft 2004 Annual Report Download - page 18
Download and view the complete annual report
Please find page 18 of the 2004 Microsoft annual report below. You can navigate through the pages in the report by either clicking on the pages listed below, or by using the keyword search tool below to find specific information within the annual report.-
 1
1 -
2
-
3
-
4
-
5
-
6
-
7
-
 8
8 -
 9
9 -
 10
10 -
 11
11 -
 12
12 -
 13
13 -
 14
14 -
 15
15 -
 16
16 -
 17
17 -
 18
18 -
 19
19 -
 20
20 -
 21
21 -
 22
22 -
 23
23 -
 24
24 -
 25
25 -
 26
26 -
 27
27 -
 28
28 -
29
-
30
-
31
-
32
-
33
-
34
-
35
-
36
-
37
-
38
-
39
-
40
-
41
-
42
-
43
-
44
-
45
-
46
-
47
-
48
-
49
-
50
-
51
-
52
-
53
-
54
-
55
-
56
-
57
-
58
-
59
-
60
-
61
-
62
-
63
-
64
-
65
 |
 |

MANAGEMENT’S DISCUSSION AND ANALYSIS OF
FINANCIAL CONDITION AND RESULTS OF OPERATIONS (CONTINUED)
PAGE 18
grow from 13% to 15% in fiscal 2005 compared to fiscal 2004. These lower growth rates may cause slower revenue
growth in fiscal 2005. We are anticipating little or no year-over-year foreign exchange rate benefit in fiscal 2005.
We anticipate that we will renew between 10% and 30% of the expiring Upgrade Advantage program revenue through
conversions to Software Assurance or migration to Enterprise Agreements. Total revenue expected to be recognized in
our Information Worker, Server and Tools, and Client businesses from previously deferred Upgrade Advantage revenue is
$56 million.
MSN had a strong year in fiscal 2004 with revenue growth of 13% driven by over 40% growth in advertising revenue. In
fiscal 2005, we expect MSN to see growth in advertising revenue and subscription and transaction revenue from premium
Web services, partially offset by a reduction in access revenue as narrowband subscribers continue to decline.
Accordingly, we do not expect the same level of revenue growth for MSN in fiscal 2005.
Home and Entertainment revenue grew moderately in fiscal 2004. We do not expect significant growth in Home and
Entertainment in fiscal 2005 as price reductions in the second half of fiscal 2004 related to the late stage of the Xbox
lifecycle are expected to lead to lower revenue for the Xbox business.
We expect our operating income growth in fiscal 2005 to exceed our revenue growth. Operating income is expected to
reflect lower operating expenses due to the absence of certain legal settlements which occurred in fiscal 2004, lower
stock-based compensation costs, and benefits achieved through continued progress in our previously announced cost
efficacy initiative. We expect that our segments in fiscal 2004 that reported a segment operating loss – Mobile and
Embedded Devices, Microsoft Business Solutions, and Home and Entertainment – will make significant progress toward
segment profitability in fiscal 2005 with improved operations.
SEGMENT PRODUCT REVENUE/OPERATING INCOME (LOSS)
Our seven segments are: Client; Server and Tools; Information Worker; Microsoft Business Solutions; MSN; Mobile and
Embedded Devices; and Home and Entertainment.
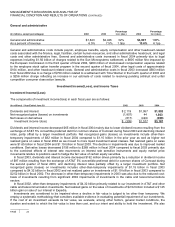
The revenue and operating income/(loss) amounts MD&A are presented on a basis consistent with U.S. GAAP applied
at the segment level. Certain corporate level expenses have been excluded. Those expenses primarily include corporate
operations related to sales and marketing, product support services, human resources, legal, finance, IT, corporate
development and procurement activities, research and development and other costs, and accrued legal contingencies.
Corporate expenses were $3.08 billion, $3.74 billion and $4.66 billion in fiscal 2002, 2003 and 2004 respectively. Segment
information appearing in Note 18 – Segment Information of the Notes to Financial Statements is presented in accordance
with SFAS 131, Disclosures about Segments of an Enterprise and Related Information.
The tables that follow below for each segment present our segment revenue and operating income, determined on a basis
consistent with U.S. GAAP:
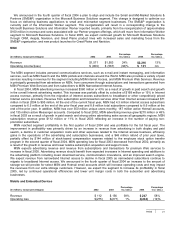
Client
(In millions, except percentages) 2002 2003
Percentage
inc./ (dec.) 2004
Percentage
inc./ (dec.)
Revenue $9,360 $10,394 11% $11,546 11%
Operating income $7,105 $ 8,017 13% $ 8,015 nm
Client includes revenue from Windows XP Professional and Home, Windows 2000 Professional, and other standard
Windows operating systems. The growth of the Client segment’s revenue is largely correlated with the growth of
purchases of PCs from OEMs that pre-install versions of Windows operating systems.
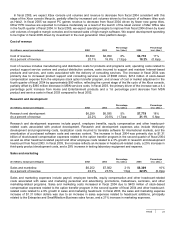
Client revenue increase was driven by a 14% growth in OEM licenses and 16% growth in OEM revenue on increased
consumer PC unit shipments in the first half of the fiscal year and growth in business PC unit shipments in the second half
of fiscal 2004. Revenue from commercial and retail licensing declined 4% due to lower revenue earned from Upgrade
Advantage licensing agreements and lower packaged product sales. In fiscal 2003, Client revenue growth was driven by
OEM licensing revenue growth of $933 million and a 9 percentage point increase in the mix of the higher priced Windows
Professional operating systems, the majority of which was in the OEM channel. Windows Professional revenue growth for
fiscal 2003 was $1.59 billion, or 31%, compared to fiscal 2002. The Windows Professional growth in fiscal 2003 was
partially offset by a $573 million decline in revenue from earlier versions of Windows operating systems.