Microsoft 2004 Annual Report Download - page 26
Download and view the complete annual report
Please find page 26 of the 2004 Microsoft annual report below. You can navigate through the pages in the report by either clicking on the pages listed below, or by using the keyword search tool below to find specific information within the annual report.-
 1
1 -
2
-
3
-
4
-
5
-
6
-
7
-
8
-
9
-
10
-
11
-
12
-
13
-
14
-
15
-
 16
16 -
 17
17 -
 18
18 -
 19
19 -
 20
20 -
 21
21 -
 22
22 -
 23
23 -
 24
24 -
 25
25 -
 26
26 -
 27
27 -
 28
28 -
 29
29 -
 30
30 -
 31
31 -
 32
32 -
 33
33 -
 34
34 -
 35
35 -
 36
36 -
37
-
38
-
39
-
40
-
41
-
42
-
43
-
44
-
45
-
46
-
47
-
48
-
49
-
50
-
51
-
52
-
53
-
54
-
55
-
56
-
57
-
58
-
59
-
60
-
61
-
62
-
63
-
64
-
65
 |
 |

MANAGEMENT’S DISCUSSION AND ANALYSIS OF
FINANCIAL CONDITION AND RESULTS OF OPERATIONS (CONTINUED)
PAGE 26
FINANCIAL CONDITION
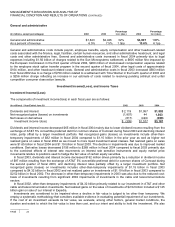
Our cash and short-term investment portfolio totaled $60.59 billion as of June 30, 2004. Equity and other investments
were $12.21 billion as of June 30, 2004. The portfolio consists primarily of fixed-income securities, diversified among
industries and individual issuers. Our investments are generally liquid and investment grade. The portfolio is invested
predominantly in U.S. dollar denominated securities, but also includes foreign currency positions, in order to diversify
financial risk. The portfolio is primarily invested in short-term securities to minimize interest rate risk and facilitate rapid
deployment for immediate cash needs.
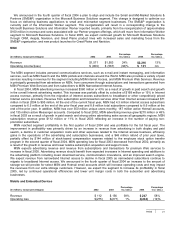
Unearned revenue from volume licensing programs represents customer billings, paid either upfront or annually at the
beginning of each billing coverage period, that are accounted for as subscriptions with revenue recognized ratably over
the billing coverage period. For certain other licensing arrangements revenue attributable to undelivered elements,
including free post-delivery telephone support and the right to receive unspecified upgrades/enhancements of Microsoft
Internet Explorer on a when-and-if-available basis, is based on the sales price of those elements when sold separately
and is recognized ratably on a straight-line basis over the related product’s life cycle. The percentage of revenue recorded
as unearned due to undelivered elements ranges from approximately 15% to 25% of the sales price for Windows XP
Home, approximately 5% to 15% of the sales price for Windows XP Professional, and approximately 1% to 15% of the
sales price for desktop applications, depending on the terms and conditions of the license and prices of the elements.
Product life cycles are currently estimated at three-and-one-half years for Windows operating systems and two years for
desktop applications. Unearned revenue also includes payments for online advertising for which the advertisement has
yet to be displayed and payments for post-delivery support services to be performed in the future.
Unearned revenue as of June 30, 2004 decreased $838 million from June 30, 2003, reflecting recognition of unearned
revenue from multi-year licensing that has outpaced additions by $397 million, primarily due to recognition from Upgrade
Advantage licensing agreements and a $489 million decline in revenue deferred for undelivered elements. Starting April 1,
2003 revenue deferred for undelivered elements reflected lower deferral rates, partially offset by lengthened product life
cycles for the underlying products licensed, resulting in a higher proportion of revenue earned. We earned approximately
$1.8 billion and $1.1 billion from the Upgrade Advantage programs for fiscal 2003 and 2004, respectively and expect to
earn approximately $56 million in fiscal 2005 from those programs.
Cash Flows
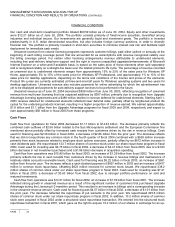
Cash flow from operations for fiscal 2004 decreased $1.17 billion to $14.63 billion. The decrease primarily reflects the
combined cash outflows of $2.56 billion related to the Sun Microsystems settlement and the European Commission fine
mentioned above partially offset by increased cash receipts from customers driven by the rise in revenue billings. Cash
used for financing was $2.36 billion in fiscal 2004, a decrease of $2.86 billion from the prior year. The decrease reflects
that we did not repurchase any common stock in the fourth quarter of fiscal 2004 combined with a $628 million increase
primarily from stock issuances related to employee stock options exercises, partially offset by an $872 million increase in
cash dividends paid. We repurchased 123.7 million shares of common stock under our share repurchase program in fiscal
2004. Cash used for investing was $2.75 billion in fiscal 2004, a decrease of $4.47 billion from fiscal 2003, due to a $3.63
billion decrease in net investment purchases and a $1.06 billion decrease in acquisition spending.
Cash flow from operations was $15.80 billion for fiscal 2003, an increase of $1.29 billion from fiscal 2002. The increase
primarily reflects the rise in cash receipts from customers driven by the increase in revenue billings and maintenance of
relatively stable accounts receivable levels. Cash used for financing was $5.22 billion in fiscal 2003, an increase of $651
million from the prior year. The increase reflects a cash dividend payment of $857 million in 2003 and an increase of $417
million in common stock repurchase, offsetting $623 million received for common stock issued. We repurchased 238.2
million shares of common stock under our share repurchase program in fiscal 2003. Cash used for investing was $7.21
billion in fiscal 2003, a decrease of $3.63 billion from fiscal 2002, due to stronger portfolio performance on sold and
matured investments.
Cash flow from operations was $14.51 billion for fiscal 2002, an increase of $1.09 billion from fiscal 2001. The increase
reflected strong growth in unearned revenue as a result of the significant number of customers that purchased Upgrade
Advantage during the Licensing 6.0 transition period. This resulted in an increase in billings and a corresponding increase
in the unearned revenue amount. Cash used for financing was $4.57 billion in fiscal 2002, a decrease of $1.01 billion from
the prior year. The decrease reflected the repurchase of put warrants in the prior year. We repurchased 245.6 million
shares of common stock under our share repurchase program in fiscal 2002. In addition, 10.2 million shares of common
stock were acquired in fiscal 2002 under a structured stock repurchase transaction. We entered into the structured stock
repurchase transaction in fiscal 2001, which gave us the right to acquire 10.2 million of our shares in exchange for an up-