Microsoft 2004 Annual Report Download - page 23
Download and view the complete annual report
Please find page 23 of the 2004 Microsoft annual report below. You can navigate through the pages in the report by either clicking on the pages listed below, or by using the keyword search tool below to find specific information within the annual report.-
 1
1 -
2
-
3
-
4
-
5
-
6
-
7
-
8
-
9
-
10
-
11
-
12
-
 13
13 -
 14
14 -
 15
15 -
 16
16 -
 17
17 -
 18
18 -
 19
19 -
 20
20 -
 21
21 -
 22
22 -
 23
23 -
 24
24 -
 25
25 -
 26
26 -
 27
27 -
 28
28 -
 29
29 -
 30
30 -
 31
31 -
 32
32 -
 33
33 -
34
-
35
-
36
-
37
-
38
-
39
-
40
-
41
-
42
-
43
-
44
-
45
-
46
-
47
-
48
-
49
-
50
-
51
-
52
-
53
-
54
-
55
-
56
-
57
-
58
-
59
-
60
-
61
-
62
-
63
-
64
-
65
 |
 |

PAGE 23
In fiscal 2005, we expect Xbox console unit volumes and revenue to decrease from fiscal 2004 consistent with this
stage of the Xbox console lifecycle, partially offset by increased unit volumes driven by the launch of software titles such
as Halo2. In fiscal 2005 we expect PC games revenue to decrease from fiscal 2004 driven by fewer new game titles.
Other HPD revenue are expected to increase moderately as a result of the launch of the latest version of Mac Office late
in the fourth quarter of fiscal 2004. In fiscal 2005, we expect operating margins to improve from fiscal 2004 driven by lower
unit volumes of negative margin consoles and increased sales of high margin software. We expect development spending
to be higher in fiscal 2005 driven by investment in the next generation Xbox platform design.
Cost of revenue
(In millions, except percentages) 2002 2003
Percentage
inc./ (dec.) 2004
Percentage
inc./ (dec.)
Cost of revenue $5,699 $6,059 6% $6,716 11%
As a percent of revenue 20.1% 18.8% (1.3)pp 18.2% (0.6)pp
Cost of revenue includes manufacturing and distribution costs for products and programs sold, operating costs related to
product support service centers and product distribution centers, costs incurred to support and maintain Internet-based
products and services, and costs associated with the delivery of consulting services. The increase in fiscal 2004 was
primarily due to increased product support and consulting services costs of $508 million, $214 million of stock-based
compensation expense from the employee stock option transfer program, and a lower of cost or market adjustment in the
fourth quarter of fiscal 2004 by approximately $90 million, reflecting the current stage of the life cycle of the Xbox console,
partially offset by $365 million decrease in MSN services costs. In fiscal 2003, the primary driver of the increase was a 4.4
percentage point increase from Home and Entertainment products and a 1.6 percentage point decrease from MSN
product and service costs in fiscal 2003 compared to fiscal 2002.
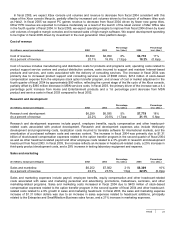
Research and development
(In millions, except percentages) 2002 2003
Percentage
inc./ (dec.) 2004
Percentage
inc./ (dec.)
Research and development $6,299 $6,595 5% $7,779 18%
As a percent of revenue 22.2% 20.5% (1.7)pp 21.1% 0.6pp
Research and development expenses include payroll, employee benefits, equity compensation and other headcount-
related costs associated with product development. Research and development expenses also include third-party
development and programming costs, localization costs incurred to translate software for international markets, and the
amortization of purchased software code and services content. The increase in fiscal 2004 was primarily due to $1.31
billion of stock-based compensation expenses related to the option transfer program in the second quarter of fiscal 2004
as well as other headcount-related payroll and other employee costs related to a 3% growth in research and development
headcount from fiscal 2003. In fiscal 2003, the increase reflects an increase in headcount-related costs, a 25% increase in
third-party product development costs, and a 29% increase in testing laboratory equipment and expense.
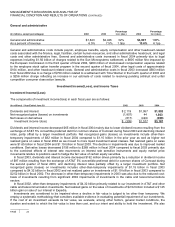
Sales and marketing
(In millions, except percentages) 2002 2003
Percentage
inc./ (dec.) 2004
Percentage
inc./ (dec.)
Sales and marketing $6,252 $7,562 21% $8,309 10%
As a percent of revenue 22.0% 23.5% 1.5pp 22.6% (0.9)pp
Sales and marketing expenses include payroll, employee benefits, equity compensation and other headcount-related
costs associated with sales and marketing personnel and advertising, promotions, tradeshows, seminars, and other
marketing-related programs. Sales and marketing costs increased in fiscal 2004 due to $400 million of stock-based
compensation expenses related to the option transfer program in the second quarter of fiscal 2004 and other headcount-
related costs related to a 9% growth in sales and marketing headcount. In fiscal 2003, the sales and marketing expense
increase of $1.31 billion dollars was due to an increase in sales expenses related to headcount additions, principally
related to the Enterprise and Small/Medium Business sales forces, and a 21% increase in marketing expenses.