Microsoft 2004 Annual Report Download - page 22
Download and view the complete annual report
Please find page 22 of the 2004 Microsoft annual report below. You can navigate through the pages in the report by either clicking on the pages listed below, or by using the keyword search tool below to find specific information within the annual report.-
 1
1 -
2
-
3
-
4
-
5
-
6
-
7
-
8
-
9
-
10
-
11
-
 12
12 -
 13
13 -
 14
14 -
 15
15 -
 16
16 -
 17
17 -
 18
18 -
 19
19 -
 20
20 -
 21
21 -
 22
22 -
 23
23 -
 24
24 -
 25
25 -
 26
26 -
 27
27 -
 28
28 -
 29
29 -
 30
30 -
 31
31 -
 32
32 -
33
-
34
-
35
-
36
-
37
-
38
-
39
-
40
-
41
-
42
-
43
-
44
-
45
-
46
-
47
-
48
-
49
-
50
-
51
-
52
-
53
-
54
-
55
-
56
-
57
-
58
-
59
-
60
-
61
-
62
-
63
-
64
-
65
 |
 |

MANAGEMENT’S DISCUSSION AND ANALYSIS OF
FINANCIAL CONDITION AND RESULTS OF OPERATIONS (CONTINUED)
PAGE 22
Mobile and Embedded Devices includes Windows Mobile software, Windows Embedded device operating systems,
MapPoint, and Windows Automotive. The segment’s products extend the advantages of the Windows platform to mobile
phones and Pocket PCs. The segment is also responsible for managing sales and customer relations with device
manufacturers and with network service providers, including telecommunications, cable and wireless companies, and host
and network equipment providers. The embedded operating system market is highly fragmented with many competitive
offerings and relatively short product life cycles that affect our continuing revenue streams.
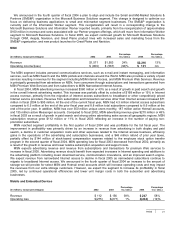
Unit volume increases drove revenue growth for fiscal 2004 over fiscal 2003 in all product lines. The growth was
primarily due to the increase in the number of OEMs and mobile operators shipping Windows Mobile software for
SmartPhones, increases in market share for our Pocket PC and embedded products and increased usage by existing
customers of our MapPoint Web Service. Revenue for fiscal 2003 grew $44 million driven by increased Pocket PC
shipments and MapPoint licensing.
Mobile and Embedded Devices’ operating loss for fiscal 2004 decreased compared to fiscal 2003 primarily due to
growth in revenue and lower marketing expenses, partially offset by $58 million of stock-based compensation expense
from the employee stock option transfer program in the second quarter of fiscal 2004. Operating loss for fiscal 2003 grew
1% from the prior year as higher marketing expenses and headcount-related costs associated with product development
offset the growth in revenue.
We expect demand for mobile and embedded devices based on Windows Mobile software to be driven by an overall
increase in customer demand for connectivity as well as by an increase in the number of OEMs and mobile operators
offering Windows-based devices.
Home and Entertainment
(In millions, except percentages) 2002 2003
Percentage
inc./ (dec.) 2004
Percentage
inc./ (dec.)
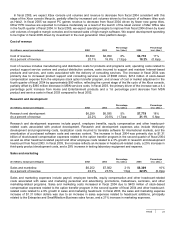
Revenue $ 2,453 $ 2,748 12% $ 2,876 5%
Operating loss $(1,135) $(1,191) 5% $(1,215) 2%
Home and Entertainment includes the Microsoft Xbox video game console system, PC games, the Home Products
Division (HPD), and TV platform products for the interactive television industry. The relative success of competing video
game consoles is determined by console functionality, the portfolio of video game content for the console, and the relative
market share of the console. We are a relatively new entrant in the video game console businesses with our first release
in fiscal 2002, and have established ourselves as one of the leaders. Revenue and unit volumes have grown quickly since
2002, but revenue growth moderated in fiscal 2004 due to price reductions typical at this stage in the console lifecycle.
We believe our competitive position and revenue is bolstered by our increasing software game attach rates, providing
higher margins to offset the decreasing price trend on consoles sold.
In fiscal 2004, Xbox revenue increased $144 million or 9% with $269 million related to higher Xbox software volumes
and $117 million due to higher Xbox console volumes, partially offset by a $242 million decline related to price reductions
of Xbox consoles and software. Overall, Xbox console volumes increased 11% in fiscal 2004 compared to fiscal 2003.
The Xbox life-to-date U.S. games attach rate increased to 6.9 games per console according to industry analyst NPD as of
June 30, 2004. Revenue from consumer hardware and software, PC games and TV platforms declined $16 million or 1%
compared to fiscal 2003 due to lower PC games software and PC gaming devices sales, partially offset by the new
release of Mac Office. The increase in Home and Entertainment revenue in fiscal 2003 from fiscal 2002 was the result of
sales of Xbox video game systems and related games which were available for all of fiscal 2003. Xbox revenue grew
$309 million or 23% in fiscal 2003 reflecting a $779 million increase from higher volumes for Xbox consoles, games, and
peripherals partially offset by a $470 million decrease due to price changes. Revenue from consumer hardware and
software and PC games declined $14 million or 1% in fiscal 2003, driving the decrease in Home Products revenue.
The increase in operating loss in fiscal 2004 was primarily due to $141 million of stock-based compensation expense
from the employee stock option transfer program in the second quarter of fiscal 2004, increased sales of negative margin
consoles, and costs associated with the next generation console development efforts, partially offset by increased Xbox
and Mac Office software sales. The operating loss increase from fiscal 2003 also included a lower of cost or market
adjustment of approximately $90 million, reflecting the current stage in the lifecycle of the Xbox console. Operating loss in
2003 increased by $56 million or 5% from the prior year as the product costs associated with the increased Xbox console
sales and increased marketing expense more than offset the 12% increase in revenue.