Microsoft 2004 Annual Report Download - page 60
Download and view the complete annual report
Please find page 60 of the 2004 Microsoft annual report below. You can navigate through the pages in the report by either clicking on the pages listed below, or by using the keyword search tool below to find specific information within the annual report.-
 1
1 -
2
-
3
-
4
-
5
-
6
-
7
-
8
-
9
-
10
-
11
-
12
-
13
-
14
-
15
-
16
-
17
-
18
-
19
-
20
-
21
-
22
-
23
-
24
-
25
-
26
-
27
-
28
-
29
-
30
-
31
-
32
-
33
-
34
-
35
-
36
-
37
-
38
-
39
-
40
-
41
-
42
-
43
-
44
-
45
-
46
-
47
-
48
-
49
-
 50
50 -
 51
51 -
 52
52 -
 53
53 -
 54
54 -
 55
55 -
 56
56 -
 57
57 -
 58
58 -
 59
59 -
 60
60 -
 61
61 -
 62
62 -
 63
63 -
 64
64 -
 65
65
 |
 |

PAGE 60
Microsoft Business Solutions – Microsoft Great Plains, Microsoft Navision, Microsoft Axapta, Microsoft Solomon,
Microsoft CRM, MBN/Retail Manager and other business applications and services.
MSN – Personal communication services, such as e-mail and instant messaging, information services, such as MSN
Search and the MSN portals and channels, and paid services including MSN Internet access, MSN Premium Web
services, and MSN Mobile service.
Mobile and Embedded Devices – Windows Mobile software, Windows Embedded device operating systems, MapPoint,
and Windows Automotive.
Home and Entertainment – Xbox video game system, PC games, the Home Products Division (HPD), and TV platform
products.
Because of our integrated business structure, operating costs included in one segment may benefit other segments,
and therefore these segments are not designed to measure operating income or loss directly related to the products
included in each segment. Inter-segment cost commissions are estimated by management and used to compensate or
charge each segment for such shared costs and to incent shared efforts. Management will continually evaluate the
alignment of product development organizations, sales organizations, and inter-segment commissions for segment
reporting purposes, which may result in changes to segment allocations in future periods.
Assets are not allocated to segments for internal reporting presentations. A portion of amortization and depreciation is
included with various other costs in an overhead allocation to each segment and it is impracticable for us to separately
identify the amount of amortization and depreciation by segment that is included in the measure of segment profit or loss.
Reconciling amounts include adjustments to conform with U.S. GAAP and corporate level activity not specifically
attributed to a segment. Significant internal accounting policies that differ from U.S. GAAP relate to revenue recognition,
income statement classification, quarter end cut off timing, and accelerated amortization for depreciation, stock awards
and performance-based stock awards. In addition, certain revenue and expenses are excluded from segments or included
in corporate level activity including certain legal settlements and legal contingent liabilities.
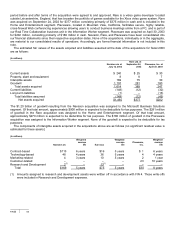
Significant reconciling items are as follows:
(In millions)
Y
ear Ended June 30 2002 2003 2004
Operating income reconciling amounts:
Legal settlements and contingent liabilities $ (673) $ (1,079) $ (2,778)
Stock-based compensation expense (3,784) (3,749) (4,773)
Revenue reconciling amounts 288 (392) 576
Other (889) (1,253) (2,457)
Total $ (5,058) $ (6,473) $ (9,432)
Other primarily includes corporate operations related to sales and marketing, product support services, human resources,
legal, finance, IT, corporate development and procurement activities; research and development; and various amounts to
conform with U.S. GAAP.
Sales to Dell and its subsidiaries in the aggregate accounted for approximately 10% of total fiscal 2004 revenue. These
sales were made primarily through our OEM and volume licensing channels and were included in all operating segments.
No single customer accounted for more than 10% of revenue in 2002 or 2003.
Revenue, classified by the major geographic areas in which we operate, is as follows:
(In millions)
Y
ear Ended June 30 2002 2003 2004
United States(1) $20,066 $22,077 $25,046
Other countries 8,299 10,110 11,789
Total $28,365 $32,187 $36,835
(1) Includes shipments to customers in the United States, licensing to certain OEMs and multinational organizations,
and exports of finished goods, primarily to Asia, Latin America, and Canada.