Microsoft 2004 Annual Report Download - page 37
Download and view the complete annual report
Please find page 37 of the 2004 Microsoft annual report below. You can navigate through the pages in the report by either clicking on the pages listed below, or by using the keyword search tool below to find specific information within the annual report.-
 1
1 -
2
-
3
-
4
-
5
-
6
-
7
-
8
-
9
-
10
-
11
-
12
-
13
-
14
-
15
-
16
-
17
-
18
-
19
-
20
-
21
-
22
-
23
-
24
-
25
-
26
-
 27
27 -
 28
28 -
 29
29 -
 30
30 -
 31
31 -
 32
32 -
 33
33 -
 34
34 -
 35
35 -
 36
36 -
 37
37 -
 38
38 -
 39
39 -
 40
40 -
 41
41 -
 42
42 -
 43
43 -
 44
44 -
 45
45 -
 46
46 -
 47
47 -
48
-
49
-
50
-
51
-
52
-
53
-
54
-
55
-
56
-
57
-
58
-
59
-
60
-
61
-
62
-
63
-
64
-
65
 |
 |

PAGE 37
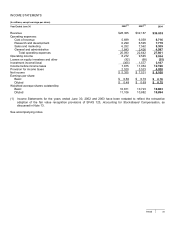
CASH FLOWS STATEMENTS
(In millions)
Y
ear Ended June 30 2002
(1)
2003
(1)
2004
Operations
Net income $ 5,355 $ 7,531
$ 8,168
Depreciation, amortization, and other noncash items 938 1,393 1,186
Stock-based compensation 3,784 3,749 5,734
Net recognized (gains)/losses on investments 2,424 380 (1,296)
Stock option income tax benefits 1,596 1,365 1,100
Deferred income taxes (1,580) (894) (1,479)
Unearned revenue 11,152 12,519 11,777
Recognition of unearned revenue (8,929) (11,292) (12,527)
Accounts receivable (1,623) 187 (687)
Other current assets (264) 412 478
Other long-term assets (9) (28) 34
Other current liabilities 1,449 35 2,063
Other long-term liabilities 216 440 75
Net cash from operations 14,509 15,797 14,626
Financing
Common stock issued 1,497 2,120 2,748
Common stock repurchased (6,069) (6,486) (3,383)
Common stock dividend – (857) (1,729)
Net cash used for financing (4,572) (5,223) (2,364)
Investing
Additions to property and equipment (770) (891) (1,109)
Acquisition of companies, net of cash acquired – (1,063) (4)
Purchases of investments (89,386) (89,621) (92,495)
Maturities of investments 8,654 9,205 5,561
Sales of investments 70,657 75,157 85,302
Net cash used for investing (10,845) (7,213) (2,745)
Net change in cash and equivalents (908) 3,361 9,517
Effect of exchange rates on cash and equivalents 2 61 27
Cash and equivalents, beginning of period 3,922 3,016 6,438
Cash and equivalents, end of period $ 3,016 $ 6,438 $15,982
(1) June 30, 2002 and 2003 cash flow statements have been restated for retroactive adoption of the fair value
recognition provisions of SFAS 123, Accounting for Stock-Based Compensation, as discussed in Note 13.
See accompanying notes.