Microsoft 2004 Annual Report Download - page 35
Download and view the complete annual report
Please find page 35 of the 2004 Microsoft annual report below. You can navigate through the pages in the report by either clicking on the pages listed below, or by using the keyword search tool below to find specific information within the annual report.-
 1
1 -
2
-
3
-
4
-
5
-
6
-
7
-
8
-
9
-
10
-
11
-
12
-
13
-
14
-
15
-
16
-
17
-
18
-
19
-
20
-
21
-
22
-
23
-
24
-
 25
25 -
 26
26 -
 27
27 -
 28
28 -
 29
29 -
 30
30 -
 31
31 -
 32
32 -
 33
33 -
 34
34 -
 35
35 -
 36
36 -
 37
37 -
 38
38 -
 39
39 -
 40
40 -
 41
41 -
 42
42 -
 43
43 -
 44
44 -
 45
45 -
46
-
47
-
48
-
49
-
50
-
51
-
52
-
53
-
54
-
55
-
56
-
57
-
58
-
59
-
60
-
61
-
62
-
63
-
64
-
65
 |
 |

PAGE 35
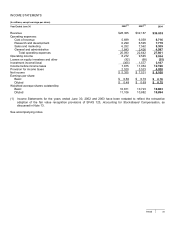
INCOME STATEMENTS
(In millions, except earnings per share)
Year Ended June 30 2002
(1)
2003
(1)
2004
Revenue $28,365 $32,187
$36,835
Operating expenses:
Cost of revenue 5,699 6,059 6,716
Research and development 6,299 6,595 7,779
Sales and marketing 6,252 7,562 8,309
General and administrative 1,843 2,426 4,997
Total operating expenses 20,093 22,642 27,801
Operating income 8,272 9,545 9,034
Losses on equity investees and other (92) (68) (25)
Investment income/(loss) (305) 1,577 3,187
Income before income taxes 7,875 11,054 12,196
Provision for income taxes 2,520 3,523 4,028
Net income $ 5,355 $ 7,531 $ 8,168
Earnings per share:
Basic $ 0.50 $ 0.70 $ 0.76
Diluted $ 0.48 $ 0.69 $ 0.75
Weighted average shares outstanding:
Basic 10,811 10,723 10,803
Diluted 11,106 10,882 10,894
(1) Income Statements for the years ended June 30, 2002 and 2003 have been restated to reflect the retroactive
adoption of the fair value recognition provisions of SFAS 123, Accounting for Stock-Based Compensation, as
discussed in Note 13.
See accompanying notes.