Microsoft 2004 Annual Report Download - page 53
Download and view the complete annual report
Please find page 53 of the 2004 Microsoft annual report below. You can navigate through the pages in the report by either clicking on the pages listed below, or by using the keyword search tool below to find specific information within the annual report.-
 1
1 -
2
-
3
-
4
-
5
-
6
-
7
-
8
-
9
-
10
-
11
-
12
-
13
-
14
-
15
-
16
-
17
-
18
-
19
-
20
-
21
-
22
-
23
-
24
-
25
-
26
-
27
-
28
-
29
-
30
-
31
-
32
-
33
-
34
-
35
-
36
-
37
-
38
-
39
-
40
-
41
-
42
-
 43
43 -
 44
44 -
 45
45 -
 46
46 -
 47
47 -
 48
48 -
 49
49 -
 50
50 -
 51
51 -
 52
52 -
 53
53 -
 54
54 -
 55
55 -
 56
56 -
 57
57 -
 58
58 -
 59
59 -
 60
60 -
 61
61 -
 62
62 -
 63
63 -
64
-
65
 |
 |

NOTES TO FINANCIAL STATEMENTS (CONTINUED)
PAGE 53
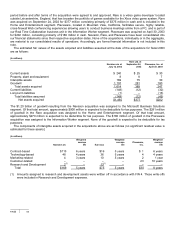
For various price ranges, weighted average characteristics of outstanding employee stock options at June 30, 2004 are as
follows:
(In millions, except per share amounts)
Outstanding options Exercisable options
Range of exercise prices Shares
Remaining
life (years)
Weighted
average price Shares
Weighted
average price
$ 0.00 – $15.00 37 1.82 $ 6.60 36 $ 6.53
15.01 – 25.00 244 7.24 23.33 75 21.78
25.01 – 33.00 387 5.62 28.24 237 28.17
33.01 – 41.00 169 4.17 34.22 127 34.25
41.01 – 59.56 112 4.40 44.80 94 44.66
949 569
As of June 30, 2004, 345 million transferred options to JP Morgan remained outstanding and are excluded from the
amounts noted as employee options outstanding in the tables above. See Note 11. In addition, the tables above include in
the total options outstanding 6.8 million options outstanding that were granted in conjunction with corporate acquisitions.
These options are included in the option totals; however, they are excluded from the exercise price ranges presented.
These options had an exercise price range of $0.00 to $204.09 and a weighted average exercise price of $14.13.
NOTE 14 EARNINGS PER SHARE
Basic earnings per share is computed on the basis of the weighted average number of shares of common stock
outstanding during the period. Diluted earnings per share is computed on the basis of the weighted average number of
shares of common stock plus the effect of dilutive potential common shares outstanding during the period using the
treasury stock method. Dilutive potential common shares include outstanding stock options, stock awards, and shared
performance stock awards. The components of basic and diluted earnings per share are as follows:
(In millions, except earnings per share)
Y
ear Ended June 30 2002 2003 2004
Net income available for common shareholders (A) $ 5,355 $ 7,531 $ 8,168
Weighted average outstanding shares of common stock (B) 10,811 10,723 10,803
Dilutive effect of employee stock options and awards 295 159 91
Common stock and common stock equivalents (C) 11,106 10,882 10,894
Earnings per share:
Basic (A/B) $ 0.50 $ 0.70 $ 0.76
Diluted (A/C) $ 0.48 $ 0.69 $ 0.75
For the years ended June 30, 2002, 2003 and 2004, 746 million, 1.09 billion and 1.2 billion shares attributable to
outstanding stock options were excluded from the calculation of diluted earnings per share because the exercise prices of
the stock options were greater than or equal to the average price of the common shares, and therefore their inclusion
would have been anti-dilutive. For the year ended June 30, 2004, 21.9 million shared performance stock awards, out of
31.7 million targeted amount granted, have been excluded from the calculation of diluted earnings per share because the
number of shares ultimately issued is contingent on our performance against metrics established for the performance
period, as discussed in Note 13 – Employee Stock and Savings Plans.
NOTE 15 ACQUISITIONS
In fiscal 2004, we had no material acquisitions. In fiscal 2003, we acquired all of the outstanding equity interests of
Navision a/s, Rare Ltd., and Placeware, Inc. Navision, headquartered in Vedbaek, Denmark, is a provider of integrated
business solutions software for small and mid-sized businesses in the European market that is part of the Microsoft
Business Solutions segment. We acquired Navision on July 12, 2002 for $1.465 billion consisting primarily of $662 million
in cash and the issuance of 29.1 million common shares of our common stock valued at $773 million. The value of the
common shares issued was determined based on the average market price of our common shares over the two-day