Microsoft 2004 Annual Report Download - page 45
Download and view the complete annual report
Please find page 45 of the 2004 Microsoft annual report below. You can navigate through the pages in the report by either clicking on the pages listed below, or by using the keyword search tool below to find specific information within the annual report.-
 1
1 -
2
-
3
-
4
-
5
-
6
-
7
-
8
-
9
-
10
-
11
-
12
-
13
-
14
-
15
-
16
-
17
-
18
-
19
-
20
-
21
-
22
-
23
-
24
-
25
-
26
-
27
-
28
-
29
-
30
-
31
-
32
-
33
-
34
-
 35
35 -
 36
36 -
 37
37 -
 38
38 -
 39
39 -
 40
40 -
 41
41 -
 42
42 -
 43
43 -
 44
44 -
 45
45 -
 46
46 -
 47
47 -
 48
48 -
 49
49 -
 50
50 -
 51
51 -
 52
52 -
 53
53 -
 54
54 -
 55
55 -
56
-
57
-
58
-
59
-
60
-
61
-
62
-
63
-
64
-
65
 |
 |

NOTES TO FINANCIAL STATEMENTS (CONTINUED)
PAGE 45
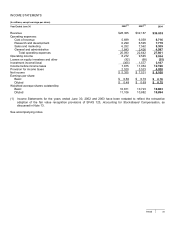
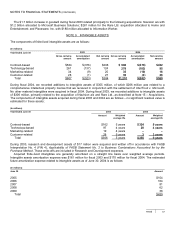
Common and preferred stock and other investments that are restricted for more than one year or are not publicly
traded are recorded at cost. At June 30, 2003, the recorded basis of these investments was $2.15 billion, and their
estimated fair value was $2.56 billion. At June 30, 2004 the recorded basis of these investments was $1.65 billion, and
their estimated fair value was $2.12 billion. The estimate of fair value is based on publicly available market information or
other estimates determined by management.
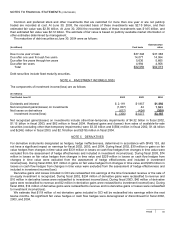
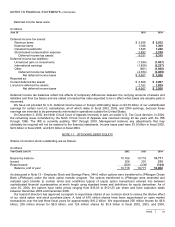
The maturities of debt securities at June 30, 2004 were as follows:
(In millions) Cost basis
Estimated fair
value
Due in one year or less $37,348 $37,388
Due after one year through five years 14,077 14,064
Due after five years through ten years 5,636 5,665
Due after ten years 4,994 4,956
Total $62,055 $62,073
Debt securities include fixed maturity securities.
NOTE 4 INVESTMENT INCOME/(LOSS)
The components of investment income/(loss) are as follows:
(In millions)
Y
ear Ended June 30 2002 2003 2004
Dividends and interest $ 2,119 $1,957 $1,892
Net recognized gains/(losses) on investments (1,807) 44 1,563
Net losses on derivatives (617) (424) (268)
Investment income/(loss) $ (305) $1,577 $3,187
Net recognized gains/(losses) on investments include other-than-temporary impairments of $4.32 billion in fiscal 2002,
$1.15 billion in fiscal 2003, and $82 million in fiscal 2004. Realized gains and (losses) from sales of available-for-sale
securities (excluding other-than-temporary impairments) were $3.02 billion and $(504) million in fiscal 2002, $1.44 billion
and $(245) million in fiscal 2003, and $2.16 billion and $(518) million in fiscal 2004.
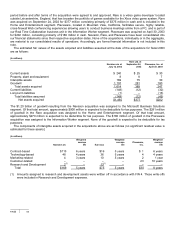
NOTE 5 DERIVATIVES
For derivative instruments designated as hedges, hedge ineffectiveness, determined in accordance with SFAS 133, did
not have a significant impact on earnings for fiscal 2002, 2003, and 2004. During fiscal 2002, $30 million in gains on fair
value hedges from changes in time value and $331 million in losses on cash flow hedges from changes in time value were
excluded from the assessment of hedge effectiveness and included in investment income/(loss). During fiscal 2003, $74
million in losses on fair value hedges from changes in time value and $229 million in losses on cash flow hedges from
changes in time value were excluded from the assessment of hedge effectiveness and included in investment
income/(loss). During fiscal 2004, $31 million in gains on fair value hedges from changes in time value and $325 million in
losses on cash flow hedges from changes in time value were excluded from the assessment of hedge effectiveness and
included in investment income/(loss).
Derivative gains and losses included in OCI are reclassified into earnings at the time forecasted revenue or the sale of
an equity investment is recognized. During fiscal 2002, $234 million of derivative gains were reclassified to revenue and
$10 million in derivative losses were reclassified to investment income/(loss). During fiscal 2003, $40 million of derivative
gains were reclassified to revenue and $2 million in derivative gains were reclassified to investment income/(loss). During
fiscal 2004, $14 million of derivative gains were reclassified to revenue and no derivative gains or losses were reclassified
to investment income/(loss).
We estimate that $119 million of net derivative gains included in OCI will be reclassified into earnings within the next
twelve months. No significant fair value hedges or cash flow hedges were derecognized or discontinued for fiscal 2002,
2003, and 2004.