Microsoft 2004 Annual Report Download - page 52
Download and view the complete annual report
Please find page 52 of the 2004 Microsoft annual report below. You can navigate through the pages in the report by either clicking on the pages listed below, or by using the keyword search tool below to find specific information within the annual report.-
 1
1 -
2
-
3
-
4
-
5
-
6
-
7
-
8
-
9
-
10
-
11
-
12
-
13
-
14
-
15
-
16
-
17
-
18
-
19
-
20
-
21
-
22
-
23
-
24
-
25
-
26
-
27
-
28
-
29
-
30
-
31
-
32
-
33
-
34
-
35
-
36
-
37
-
38
-
39
-
40
-
41
-
 42
42 -
 43
43 -
 44
44 -
 45
45 -
 46
46 -
 47
47 -
 48
48 -
 49
49 -
 50
50 -
 51
51 -
 52
52 -
 53
53 -
 54
54 -
 55
55 -
 56
56 -
 57
57 -
 58
58 -
 59
59 -
 60
60 -
 61
61 -
 62
62 -
63
-
64
-
65
 |
 |
PAGE 52
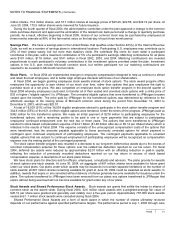
30, 2006 (January 1, 2004 through June 30, 2006 for certain executive officers). At the end of the performance period, the
number of shares of stock and stock awards issued will be determined by adjusting upward or downward from the target
in a range between 33% and 150% (0% to 150% for certain executive officers). The final performance percentage on
which the payout will be based, considering performance metrics established for the performance period, will be
determined by the board of directors or a committee of the board in its sole discretion. Shares of stock will be issued at
the end of the performance period and as the stock awards vest ratably over the following two years. In fiscal 2004,
Shared Performance Stock Awards representing the targeted number of shares for the performance period ending June
30, 2006 were granted in the aggregate amount of 31.7 million shares with a weighted average fair value of $26.08 per
share. Because these awards cover a three-year period, Shared Performance Stock Awards will only be awarded in fiscal
2005 and 2006 to newly hired and promoted employees eligible to receive Shared Performance Stock Awards. No shared
performance stock awards vested and 1.2 million shared performance stock awards were cancelled during fiscal 2004.
Stock Awards and Shared Performance Stock Awards are amortized over 5 years using the straight line method.
Stock Options. Nonqualified stock options have been granted to our directors under our non-employee director stock
plans. Nonqualified and incentive stock options have been granted to our officers and employees under our employee
stock plans. Options granted before 1995 generally vest over four and one-half years and expire ten years from the date
of grant. Options granted between 1995 and 2001 generally vest over four and one-half years and expire seven years
from the date of grant, while certain options vest either over four and one-half years or over seven and one-half years and
expire ten years from the date of grant. Options granted after 2001 vest over four and one-half years and expire ten years
from the date of grant. At June 30, 2004, stock options for 569 million shares were vested.
The weighted average Black-Scholes value of options granted under the stock plans during fiscal 2002, 2003, and
2004 was $15.79, $12.08, and $10.13, respectively. The fair value of each option grant is estimated on the date of grant
using the Black-Scholes option-pricing model with the following weighted average assumptions used for grants:
Y
ear Ended June 30 2002 2003 2004
Weighted average expected life in years 7 7 7
Dividend per share $ – $0.08
$0.16
Volatility 39.0% 42.0% 29.5%
Risk-free interest rate 5.4% 3.9% 4.1%
Employee stock options outstanding are as follows:
(In millions, except per share amounts)
Price per share
Shares Range
Weighted
average
Balance, June 30, 2001 1,796 $0.28 – $59.57 $24.77
Granted 82 24.31 – 36.29 31.25
Exercised (198) 0.51 – 34.91 6.41
Canceled (76) 0.58 – 58.28 34.34
Balance, June 30, 2002 1,604 0.40 – 59.57 26.88
Granted 254 21.42 – 29.12 24.27
Exercised (234) 0.51 – 28.22 6.89
Canceled (75) 2.13 – 59.56 34.33
Balance, June 30, 2003 1,549 0.40 – 59.56 29.30
Granted 2 25.46 – 29.96 26.76
Exercised (198) 0.51 – 29.38 12.21
Stock Option Transfer Program (345) 33.03 – 59.56 38.70
Canceled (59) 2.31 – 58.28 31.29
Balance, June 30, 2004 949 $0.40 – $59.56 $29.26