Microsoft 2004 Annual Report Download - page 25
Download and view the complete annual report
Please find page 25 of the 2004 Microsoft annual report below. You can navigate through the pages in the report by either clicking on the pages listed below, or by using the keyword search tool below to find specific information within the annual report.-
 1
1 -
2
-
3
-
4
-
5
-
6
-
7
-
8
-
9
-
10
-
11
-
12
-
13
-
14
-
 15
15 -
 16
16 -
 17
17 -
 18
18 -
 19
19 -
 20
20 -
 21
21 -
 22
22 -
 23
23 -
 24
24 -
 25
25 -
 26
26 -
 27
27 -
 28
28 -
 29
29 -
 30
30 -
 31
31 -
 32
32 -
 33
33 -
 34
34 -
 35
35 -
36
-
37
-
38
-
39
-
40
-
41
-
42
-
43
-
44
-
45
-
46
-
47
-
48
-
49
-
50
-
51
-
52
-
53
-
54
-
55
-
56
-
57
-
58
-
59
-
60
-
61
-
62
-
63
-
64
-
65
 |
 |

PAGE 25
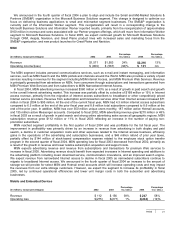
consider specific adverse conditions related to the financial health of and business outlook for the investee, including
industry and sector performance, changes in technology, operational and financing cash flow factors, and rating agency
actions. Once a decline in fair value is determined to be other than temporary, an impairment charge is recorded and a
new cost basis in the investment is established.
Income Taxes
Our effective tax rate for fiscal 2004 was 33%. A benefit of $208 million was recorded during the fourth quarter from the
reversal of previously accrued taxes from resolving the remaining open issue remanded by the 9th Circuit Court of
Appeals ruling in December 2002. The effective tax rate for the fourth quarter of fiscal 2004 was approximately 27%.
During the third quarter the tax rate increased due to the European Commission fine, which is not tax deductible.
The effective tax rate for fiscal 2003 and fiscal 2002 was 32% each year. The fiscal 2003 rate reflected a benefit in the
second quarter of $126 million from the reversal of previously accrued taxes related to the initial items from the 9th Circuit
Court of Appeals ruling referred to above, that reversed, in part, a previous Tax Court ruling that had denied tax benefits
on certain revenue earned from the distribution of software to foreign customers. Excluding this reversal, the effective tax
rate would have been 33%.
Stock-based Compensation. We implemented changes in fiscal 2004 in employee compensation designed to help us
continue to attract and retain the best employees, and to better align employee interests with those of our shareholders.
Generally, employees are now granted stock awards instead of stock options. The stock award program offers employees
the opportunity to earn shares of our stock over time, rather than options that give employees the right to purchase stock
at a set price. We also completed an employee stock option transfer program in the second quarter of fiscal 2004 whereby
employees could elect to transfer all of their vested and unvested stock options with a strike price of $33 or higher
(“eligible options”) to JPMorgan Chase Bank (JPMorgan). The unvested eligible options that were transferred to
JPMorgan became vested upon the transfer. The price paid by JPMorgan for the transferred options was determined by
reference to the arithmetic average of the closing prices of Microsoft common stock during the period from November 14,
2003 to December 8, 2003, which was $25.5720. Note 13 – Employee Stock and Savings Plan of the Notes to the
Financial Statements provides additional information on employee stock and savings plans.
In addition, effective July 1, 2003, we adopted the fair value recognition provisions of SFAS 123, Accounting for Stock-
Based Compensation, using the retroactive restatement method described in SFAS 148, Accounting for Stock-Based
Compensation – Transition and Disclosure. Under the fair value recognition provisions of SFAS 123, stock-based
compensation cost is measured at the grant date based on the value of the award and is recognized as expense over the
vesting period. The June 30, 2003 balance sheet has been restated for the retroactive adoption of the fair value
recognition provisions of SFAS 123, which resulted in a $13.89 billion increase in common stock and paid-in capital, a
$10.00 billion decrease in retained earnings, and a $3.89 billion increase in deferred income taxes.
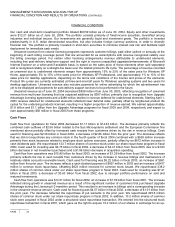
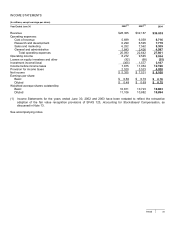
Given these changes the following table provides stock-based compensation expense for fiscal 2002 through 2004 by
segment.
(In millions, except expense per share)
(1)
2002 2003 2004
Client $ 471 $ 450 $ 738
Server and Tools 1,301 1,274 1,862
Information Worker 516 510 848
Microsoft Business Solutions 125 129 147
MSN 268 262 392
Mobile and Embedded Devices 118 129 170
Home and Entertainment 261 257 381
Corporate 724 738 1,196
Stock-based employee compensation expense $ 3,784 $3,749 $5,734
After-tax stock-based employee compensation expense $ 2,573 $2,512 $3,842
After-tax stock-based employee compensation expense per diluted share $ 0.23 $ 0.23 $ 0.35
(1) The amounts for fiscal 2004 include $2.21 billion ($1.48 billion after-tax or $0.14 per diluted share) due to the
completion of the employee stock option transfer program.