Microsoft 2004 Annual Report Download - page 20
Download and view the complete annual report
Please find page 20 of the 2004 Microsoft annual report below. You can navigate through the pages in the report by either clicking on the pages listed below, or by using the keyword search tool below to find specific information within the annual report.-
 1
1 -
2
-
3
-
4
-
5
-
6
-
7
-
8
-
9
-
 10
10 -
 11
11 -
 12
12 -
 13
13 -
 14
14 -
 15
15 -
 16
16 -
 17
17 -
 18
18 -
 19
19 -
 20
20 -
 21
21 -
 22
22 -
 23
23 -
 24
24 -
 25
25 -
 26
26 -
 27
27 -
 28
28 -
 29
29 -
 30
30 -
31
-
32
-
33
-
34
-
35
-
36
-
37
-
38
-
39
-
40
-
41
-
42
-
43
-
44
-
45
-
46
-
47
-
48
-
49
-
50
-
51
-
52
-
53
-
54
-
55
-
56
-
57
-
58
-
59
-
60
-
61
-
62
-
63
-
64
-
65
 |
 |

MANAGEMENT’S DISCUSSION AND ANALYSIS OF
FINANCIAL CONDITION AND RESULTS OF OPERATIONS (CONTINUED)
PAGE 20
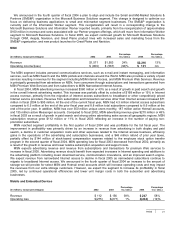
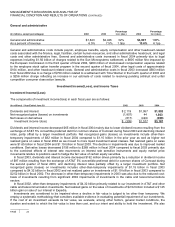
Information Worker
(In millions, except percentages) 2002 2003
Percentage
inc./ (dec.) 2004
Percentage
inc./ (dec.)
Revenue $8,212 $9,229 12% $10,800 17%
Operating income $5,932 $6,486 9% $ 7,151 10%
Information Worker consists of the Microsoft Office System of programs, servers, services, and solutions designed to
increase personal, team, and organization productivity. Information Worker includes Microsoft Office, Microsoft Project,
Microsoft Visio, SharePoint Portal Server CALs, other information worker products including Microsoft LiveMeeting and
OneNote, and professional product support services. Most revenue from this segment comes from licensing our Office
System products. Revenue growth depends on the ability to add value to the core Office product set and expand our
product offerings in other Information Worker areas such as document lifecycle and collaboration.
Revenue growth for fiscal 2004 from volume licensing, retail packaged product and pre-installed versions of Office in
Japan was 15% in aggregate. This increase was driven by recognition of unearned revenue primarily from a large
increase in multi-year licenses signed prior to the transition to our Licensing 6.0 programs and approximately $110 million
related to the launch of Office 2003. OEM licensing revenue grew 29% or $325 million. Foreign exchange rates provided
approximately $485 million or 5% of total Information Worker revenue growth. The $1.02 billion or 12% increase in
revenue in fiscal 2003 compared to fiscal 2002 was primarily due to growth in Office suites revenue associated with new
and anniversary multi-year licensing agreements and a $264 million or 28% increase in revenue from the combined total
of Microsoft Project, Microsoft Visio, and other stand-alone applications.
Information Worker operating income in fiscal 2004 increased from the prior year primarily due to growth in revenue,
partially offset by an increase in operating expenses, primarily related to $351 million of stock-based compensation
expense from the employee stock option transfer program in the second quarter of fiscal 2004 and higher sales and
marketing expenses. Information Worker operating profit for fiscal 2003 grew 9% compared to fiscal 2002, led by the 12%
increase in revenue and partially offset by a 20% growth in operating expenses related to headcount additions and
marketing expenses.
Fiscal 2005 Information Worker revenue is expected to be similar to fiscal 2004. We are expecting a reduction in
revenue earned from our Upgrade Advantage licensing agreements and no anticipated foreign exchange rate benefit. The
significant reduction in Upgrade Advantage earned revenue is expected to be offset by sustained momentum in our OEM
and multi-year licensing offerings and increased purchasing of Office System 2003 as enterprises complete their product
evaluations.
Microsoft Business Solutions
(In millions, except percentages) 2002 2003
Percentage
inc./ (dec.) 2004
Percentage
inc./ (dec.)
Revenue $ 308 $ 567 84% $ 667 18%
Operating loss $(301) $(309) 3% $(255) (17)%
Microsoft Business Solutions includes Microsoft Great Plains, Microsoft Navision, Microsoft Axapta, Microsoft Solomon,
Microsoft CRM, MBN/Retail Manager and other business applications and services. Our revenue is generally derived from
developing and marketing integrated, end-to-end business applications and services designed to help small and mid-
market businesses. The small and mid-market business applications market is highly fragmented and is intensely
competitive in all sectors. Microsoft Business Solutions revenues are affected by the general economic environment and
enterprise information technology spending in particular.
The revenue increase in fiscal 2004 was primarily attributable to continued growth in licensing of Navision and Axapta
ERP products, and new sales of Microsoft CRM. Microsoft Business Solutions revenue for fiscal 2003 grew $259 million
from fiscal 2002, of which $246 million was attributable to the acquisition of Navision at the beginning of the fiscal year.
The operating loss for fiscal 2004 declined from fiscal 2003 due to the increase in revenue and lower operating
expenses including $42 million of lower amortization costs, partially offset by $27 million in stock-based compensation
expense from the employee stock option transfer program in the second quarter of fiscal 2004. Microsoft Business
Solutions operating loss for fiscal 2003 increased from fiscal 2002 primarily due to operating losses associated with
Navision, increases in sales and marketing expenses, research and development expenses, and acquisition-related costs.