Microsoft 2004 Annual Report Download - page 24
Download and view the complete annual report
Please find page 24 of the 2004 Microsoft annual report below. You can navigate through the pages in the report by either clicking on the pages listed below, or by using the keyword search tool below to find specific information within the annual report.-
 1
1 -
2
-
3
-
4
-
5
-
6
-
7
-
8
-
9
-
10
-
11
-
12
-
13
-
 14
14 -
 15
15 -
 16
16 -
 17
17 -
 18
18 -
 19
19 -
 20
20 -
 21
21 -
 22
22 -
 23
23 -
 24
24 -
 25
25 -
 26
26 -
 27
27 -
 28
28 -
 29
29 -
 30
30 -
 31
31 -
 32
32 -
 33
33 -
 34
34 -
35
-
36
-
37
-
38
-
39
-
40
-
41
-
42
-
43
-
44
-
45
-
46
-
47
-
48
-
49
-
50
-
51
-
52
-
53
-
54
-
55
-
56
-
57
-
58
-
59
-
60
-
61
-
62
-
63
-
64
-
65
 |
 |

MANAGEMENT’S DISCUSSION AND ANALYSIS OF
FINANCIAL CONDITION AND RESULTS OF OPERATIONS (CONTINUED)
PAGE 24
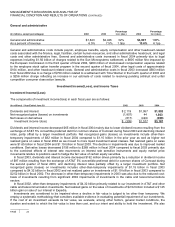
General and administrative
(In millions, except percentages) 2002 2003
Percentage
inc./ (dec.) 2004
Percentage
inc./ (dec.)
General and administrative $1,843 $2,426 32% $4,997 106%
As a percent of revenue 6.5% 7.5% 1.0pp 13.6% 6.1pp
General and administrative costs include payroll, employee benefits, equity compensation and other headcount-related
costs associated with the finance, legal, facilities, certain human resources, and other administrative headcount, and legal
costs and other administrative fees. General and administrative costs increased in fiscal 2004 primarily due to legal
expenses including $1.92 billion of charges related to the Sun Microsystems settlement, a $605 million fine imposed by
the European Commission in the third quarter of fiscal 2004, $280 million of stock-based compensation expense related
to the employee stock option transfer program in the second quarter of fiscal 2004, other legal costs of approximately
$104 million, and other headcount related costs. General and administrative costs in fiscal 2003 increased $583 million
from fiscal 2002 due to a charge of $750 million related to a settlement with Time Warner in the fourth quarter of 2003 and
a $256 million charge reflecting an increase in our estimate of costs related to resolving pending antitrust and unfair
competition consumer class action lawsuits.
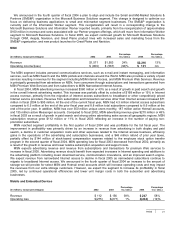
Investment Income/(Loss), and Income Taxes
Investment Income/(Loss)
The components of investment income/(loss) in each fiscal year are as follows:
(In millions) / Year Ended June 30 2002 2003 2004
Dividends and interest $ 2,119 $1,957 $1,892
Net recognized gains (losses) on investments (1,807) 44 1,563
Net losses on derivatives (617) (424) (268)
Investment income /(loss) $ (305) $1,577 $3,187
Dividends and interest income decreased $65 million in fiscal 2004 mainly due to lower dividend income resulting from the
exchange of AT&T 5% convertible preferred debt for common shares of Comcast during fiscal 2003 and declining interest
rates, partly offset by a larger investment portfolio. Net recognized gains (losses) on investments include other-than-
temporary impairments of $82 million in fiscal 2004 compared to $1.15 billion in the prior year as well as higher net
realized gains on sales in fiscal 2004 as we moved to more liquid investment asset classes. Net realized gains on sales
were $1.65 billion in fiscal 2004 and $1.19 billion in fiscal 2003. The decline in impairments was due to improved market
conditions. Derivative losses decreased $156 million to $268 million in fiscal 2004 compared to fiscal 2003 primarily due
to the combined effects of interest rate movements on interest rate sensitive instruments and equity market price
movements relative to positions used to hedge the fair value of certain equity securities.
In fiscal 2003, dividends and interest income decreased $162 million driven primarily by a reduction in dividend income
of $97 million resulting from the exchange of AT&T 5% convertible preferred debt for common shares of Comcast during
the second quarter of fiscal 2003, and declining interest rates partially offset by a larger investment portfolio. Net
recognized gains (losses) on investments includes other-than-temporary impairments of $1.15 billion in fiscal 2003
compared to $4.32 billion in fiscal 2002 and net realized gains on investments of $1.19 billion in fiscal 2003 compared to
$2.52 billion in fiscal 2002. The decrease in other-than-temporary impairments in 2003 was also due to the reduced cost-
basis of investments resulting from significant 2002 impairments of investments in the cable and telecommunications
sectors.
In fiscal 2002, other-than-temporary impairments of $4.32 billion primarily related to our investment in AT&T and other
cable and telecommunication investments. Net realized gains on the sales of investments of $2.52 billion included a $1.25
billion gain on sale of our interest in Expedia.
Investments are considered to be impaired when a decline in fair value is judged to be other than temporary. We
employ a systematic methodology that considers available evidence in evaluating potential impairment of our investments.
If the cost of an investment exceeds its fair value, we evaluate, among other factors, general market conditions, the
duration and extent to which the fair value is less than cost, and our intent and ability to hold the investment. We also