Microsoft 2004 Annual Report Download - page 34
Download and view the complete annual report
Please find page 34 of the 2004 Microsoft annual report below. You can navigate through the pages in the report by either clicking on the pages listed below, or by using the keyword search tool below to find specific information within the annual report.-
 1
1 -
2
-
3
-
4
-
5
-
6
-
7
-
8
-
9
-
10
-
11
-
12
-
13
-
14
-
15
-
16
-
17
-
18
-
19
-
20
-
21
-
22
-
23
-
 24
24 -
 25
25 -
 26
26 -
 27
27 -
 28
28 -
 29
29 -
 30
30 -
 31
31 -
 32
32 -
 33
33 -
 34
34 -
 35
35 -
 36
36 -
 37
37 -
 38
38 -
 39
39 -
 40
40 -
 41
41 -
 42
42 -
 43
43 -
 44
44 -
45
-
46
-
47
-
48
-
49
-
50
-
51
-
52
-
53
-
54
-
55
-
56
-
57
-
58
-
59
-
60
-
61
-
62
-
63
-
64
-
65
 |
 |

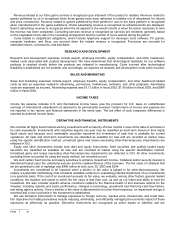
QUANTITATIVE AND QUALITATIVE DISCLOSURES ABOUT MARKET RISK
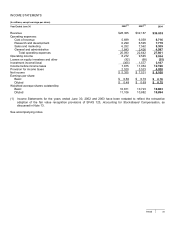
PAGE 34
We are exposed to foreign currency, interest rate, and fixed income and equity price risks. A portion of these risks is
hedged, but fluctuations could impact our results of operations and financial position. We hedge a portion of anticipated
revenue and accounts receivable exposure to foreign currency fluctuations, primarily with option contracts. We monitor
our foreign currency exposures daily to maximize the overall effectiveness of our foreign currency hedge positions.
Principal currencies hedged include the Euro, Japanese yen, British pound, and Canadian dollar. Fixed income securities
are subject to interest rate risk. The portfolio is diversified and structured to minimize credit risk. Securities held in our
equity and other investments portfolio are subject to price risk, and are generally not hedged. However, we use options to
hedge our price risk on certain equity securities that are held primarily for strategic purposes.
We use a value-at-risk (VAR) model to estimate and quantify our market risks. VAR is the expected loss, for a given
confidence level, in fair value of our portfolio due to adverse market movements over a defined time horizon. The VAR
model is not intended to represent actual losses in fair value, but is used as a risk estimation and management tool. The
model used for currencies and equities is geometric Brownian motion, which allows incorporation of optionality with regard
to these risk exposures. For interest rate risk, the mean reverting geometric Brownian motion is used to reflect the
principle that fixed-income securities prices revert to maturity value over time.
Value-at-risk is calculated by, first, simulating 10,000 market price paths over 20 days for equities, interest rates and
foreign exchange rates, taking into account historical correlations among the different rates and prices. Each resulting
unique set of equities prices, interest rates, and foreign exchange rates is then applied to substantially all individual
holdings to re-price each holding. The 250th worst performance (out of 10,000) represents the value-at-risk over 20 days
at the 97.5 percentile confidence level. Several risk factors are not captured in the model, including liquidity risk,
operational risk, credit risk, and legal risk.
Certain securities in our equity portfolio are held for strategic purposes. We hedge the value of a portion of these
securities through the use of derivative contracts such as put-call collars. In these arrangements, we hedge a security’s
equity price risk below the purchased put strike and forgo most or all of the benefits of the security’s appreciation above
the sold call strike, in exchange for premium received for the sold call. We also hold equity securities for general
investment return purposes. We have incurred material impairment charges related to these securities in prior periods.
The VAR amounts disclosed below are used as a risk management tool and reflect an estimate of potential reductions in
fair value of our portfolio. Losses in fair value over a 20-day holding period can exceed the reported VAR by significant
amounts and can also accumulate over a longer time horizon than the 20-day holding period used in the VAR analysis.
VAR amounts are not necessarily reflective of potential accounting losses, including determinations of other-than-
temporary losses in fair value in accordance with U.S. GAAP.
The VAR numbers are shown separately for interest rate, currency, and equity risks. These VAR numbers include the
underlying portfolio positions and related hedges. We use historical data to estimate VAR. Given the reliance on historical
data, VAR is most effective in estimating risk exposures in markets in which there are no fundamental changes or shifts in
market conditions. An inherent limitation in VAR is that the distribution of past changes in market risk factors may not
produce accurate predictions of future market risk.
The following table sets forth the VAR calculations for substantially all of our positions:
(In millions)
Year ended June 30, 2004
Risk Categories 2003 2004 Average High Low
Interest rates $448 $298 $625 $ 817 $ 298
Currency rates $141 $207 $217 $ 326 $ 117
Equity prices $869 $773 $969 $1,174 $ 770
The total VAR for the combined risk categories is $835 million at June 30, 2004 and $987 million at June 30, 2003. The
total VAR is 35% less at June 30, 2004 and 32% less at June, 30 2003 than the sum of the separate risk categories for
each of those years in the above table, due to the diversification benefit of the combination of risks. The change in the
absolute value of VAR is primarily due to asset allocation shifts and portfolio growth.