Nike 2009 Annual Report Download - page 25
Download and view the complete annual report
Please find page 25 of the 2009 Nike annual report below. You can navigate through the pages in the report by either clicking on the pages listed below, or by using the keyword search tool below to find specific information within the annual report.-
 1
1 -
2
-
3
-
4
-
5
-
6
-
7
-
8
-
9
-
10
-
11
-
12
-
13
-
14
-
 15
15 -
 16
16 -
 17
17 -
 18
18 -
 19
19 -
 20
20 -
 21
21 -
 22
22 -
 23
23 -
 24
24 -
 25
25 -
 26
26 -
 27
27 -
 28
28 -
 29
29 -
 30
30 -
 31
31 -
 32
32 -
 33
33 -
 34
34 -
 35
35 -
36
-
37
-
38
-
39
-
40
-
41
-
42
-
43
-
44
-
45
-
46
-
47
-
48
-
49
-
50
-
51
-
52
-
53
-
54
-
55
-
56
-
57
-
58
-
59
-
60
-
61
-
62
-
63
-
64
-
65
-
66
-
67
-
68
-
69
-
70
-
71
-
72
-
73
-
74
-
75
-
76
-
77
-
78
-
79
-
80
-
81
-
82
-
83
-
84
-
85
-
86
-
87
-
88
-
89
-
90
-
91
-
92
-
93
-
94
-
95
-
96
-
97
-
98
-
99
-
100
-
101
-
102
-
103
-
104
-
105
 |
 |
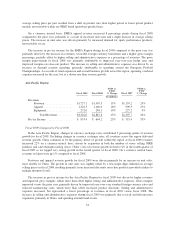
Since the adoption of this long-term strategy in 2001, on an annual compounded basis, NIKE, Inc.’s
revenues and earnings per share have grown 9% and 14%, respectively. During the same period, our return on
invested capital increased from 14% to 18%. In fiscal 2009, deteriorating macroeconomic conditions caused
significant volatility in global financial markets and put significant pressure on discretionary consumer spending
worldwide. NIKE’s fiscal 2009 revenues grew 3% to $19.2 billion, net income decreased 21% to $1.5 billion,
and we delivered diluted earnings per share of $3.03, a 19% decrease versus fiscal 2008. Our fiscal 2009 reported
results also contain significant non-comparable transactions, including after-tax charges of $144.5 million for our
restructuring activities, which were completed in the fourth quarter of fiscal 2009, and $240.7 million for the
impairment of goodwill, intangible and other assets of Umbro, which was recorded in the third quarter of fiscal
2009. Our fiscal 2008 reported results include combined gains from the sale of our Starter Brand and NIKE
Bauer Hockey businesses of $35.4 million, net of tax, and a one-time tax benefit of $105.4 million. Excluding
these non-comparable items, net income would have increased 7% to $1.9 billion and diluted earnings per share
would have increased 10% to $3.81 compared to fiscal 2008 (see Reconciliation of Net Income and Diluted
Earnings Per Share Excluding Non-Comparable items below). The increase in our net income excluding
non-comparable items was higher than our rate of revenue growth in fiscal 2009 due primarily to an increase in
other (income) expense, net, which included foreign currency conversion gains of $43.4 million compared to
foreign currency conversion losses of $76.6 million in fiscal 2008, and the recognition of licensing income of
$24.0 million related to our fiscal 2008 sale of the NIKE Bauer Hockey business. Excluding non-comparable
items, our earnings per share for the year grew at a higher rate than net income given lower outstanding shares
due to repurchases made under our share repurchase program in the first half of fiscal 2009. Our cash flows from
operations and return on invested capital both declined as compared to fiscal 2008.
During fiscal 2009, we took steps we believe prudent and necessary to identify and manage potential
exposures and to position ourselves for sustainable, profitable long-term growth. In the fourth quarter of fiscal
2009, we executed a plan of restructuring the organization to streamline our management structure, enhance
consumer focus, drive innovation more quickly to market, and establish a more scalable cost structure. As a
result of these actions, we reduced our global workforce by approximately 5% and incurred pre-tax restructuring
charges of $195 million, primarily consisting of cash charges related to severance costs. As part of this
restructuring plan, we also initiated a reorganization of the NIKE brand business into a new operating model
consisting of six geographies. As a result of the reorganization, beginning in the first quarter of fiscal 2010, our
new organizational structure will consist of the following geographies: North America, Western Europe, Central/
Eastern Europe, Greater China, Japan, and Emerging Markets.
Other steps taken in fiscal 2009 included reductions in planned selling and administrative expenses,
including the implementation of a hiring freeze, reductions in planned spending for travel, meetings and demand
creation, as well as tighter inventory purchasing and working capital management. We also placed increased
focus on monitoring the financial health of suppliers and customers and continued to take proactive measures to
consolidate production with our strongest, most efficient and innovative manufacturing contractors to ensure we
maintain a healthy production base for the present and the future. These capacity consolidation actions could
result in additional costs associated with production and logistics as well as supply chain disruptions in the first
half of fiscal year 2010 as we transition production between manufacturing contractors; however, we do not
believe these potential additional costs will have a material impact on our operating results.
We continue to believe that the Company is well positioned from a business and financial perspective, but
we are not immune to the current challenging global economic conditions. These conditions could continue to
affect our business in a number of direct and indirect ways, including lower revenue from slowing consumer/
customer demand for our products, reduced profit margins and/or increased costs, changes in interest and
currency exchange rates, lack of credit availability and business disruptions due to difficulties experiences by
suppliers and customers. Our future performance is subject to the inherent uncertainty presented by the evolving
macroeconomic conditions and our continued actions to respond to these conditions.
23