Nike 2009 Annual Report Download - page 26
Download and view the complete annual report
Please find page 26 of the 2009 Nike annual report below. You can navigate through the pages in the report by either clicking on the pages listed below, or by using the keyword search tool below to find specific information within the annual report.-
 1
1 -
2
-
3
-
4
-
5
-
6
-
7
-
8
-
9
-
10
-
11
-
12
-
13
-
14
-
15
-
 16
16 -
 17
17 -
 18
18 -
 19
19 -
 20
20 -
 21
21 -
 22
22 -
 23
23 -
 24
24 -
 25
25 -
 26
26 -
 27
27 -
 28
28 -
 29
29 -
 30
30 -
 31
31 -
 32
32 -
 33
33 -
 34
34 -
 35
35 -
 36
36 -
37
-
38
-
39
-
40
-
41
-
42
-
43
-
44
-
45
-
46
-
47
-
48
-
49
-
50
-
51
-
52
-
53
-
54
-
55
-
56
-
57
-
58
-
59
-
60
-
61
-
62
-
63
-
64
-
65
-
66
-
67
-
68
-
69
-
70
-
71
-
72
-
73
-
74
-
75
-
76
-
77
-
78
-
79
-
80
-
81
-
82
-
83
-
84
-
85
-
86
-
87
-
88
-
89
-
90
-
91
-
92
-
93
-
94
-
95
-
96
-
97
-
98
-
99
-
100
-
101
-
102
-
103
-
104
-
105
 |
 |

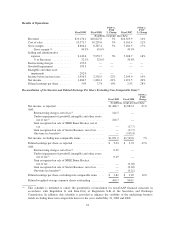
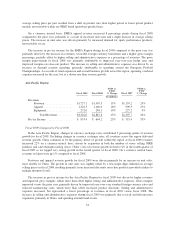
Results of Operations
Fiscal 2009 Fiscal 2008
FY09 vs.
FY08
% Change Fiscal 2007
FY08 vs.
FY07
% Change
(In millions, except per share data)
Revenues ..................... $19,176.1 $18,627.0 3% $16,325.9 14%
Cost of sales ................... 10,571.7 10,239.6 3% 9,165.4 12%
Gross margin .................. 8,604.4 8,387.4 3% 7,160.5 17%
Gross margin % ............ 44.9% 45.0% 43.9%
Selling and administrative
expense ..................... 6,149.6 5,953.7 3% 5,028.7 18%
% of Revenues ............. 32.1% 32.0% 30.8%
Restructuring charges ............ 195.0 — — — —
Goodwill impairment ............ 199.3 — — — —
Intangible and other asset
impairment .................. 202.0 — — — —
Income before income taxes ....... 1,956.5 2,502.9 -22% 2,199.9 14%
Net income .................... 1,486.7 1,883.4 -21% 1,491.5 26%
Diluted earnings per share ........ 3.03 3.74 -19% 2.93 28%
Reconciliation of Net Income and Diluted Earnings Per Share Excluding Non-Comparable Items(1)
Fiscal 2009 Fiscal 2008
FY09 vs.
FY08
Change
(In millions, except per share data)
Net income, as reported ................................. $1,486.7 $1,883.4 -21%
Add:
Restructuring charges, net of tax(2) ..................... 144.5 —
Umbro impairment of goodwill, intangible and other assets,
net of tax(3) ..................................... 240.7 —
Gain recognized on sale of NIKE Bauer Hockey, net of
tax ............................................ — (17.7)
Gain recognized on sale of Starter Business, net of tax ..... — (17.7)
One-time tax benefits(4) .............................. — (105.4)
Net income, excluding non-comparable items ................ $1,871.9 $1,742.6 7%
Diluted earnings per share, as reported ...................... $ 3.03 $ 3.74 -19%
Add:
Restructuring charges, net of tax(2) ..................... 0.29 —
Umbro impairment of goodwill, intangible and other assets,
net of tax(3) ..................................... 0.49 —
Gain recognized on sale of NIKE Bauer Hockey,
netoftax ....................................... — (0.04)
Gain recognized on sale of Starter Business, net of tax ..... — (0.04)
One-time tax benefits(4) .............................. — (0.21)
Diluted earnings per share, excluding non-comparable items .... $ 3.81 $ 3.45 10%
Diluted weighted average common shares outstanding ......... 490.7 504.1
(1) This schedule is intended to satisfy the quantitative reconciliation for non-GAAP financial measures in
accordance with Regulation G and Item 10(e) of Regulation S-K of the Securities and Exchange
Commission. In addition, this schedule is provided to enhance the visibility of the underlying business
trends excluding these non-comparable items for the years ended May 31, 2009 and 2008.
24