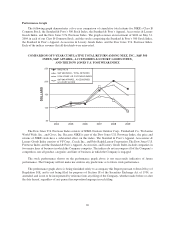
Nike 2009 Annual Report Download - page 28
Download and view the complete annual report
Please find page 28 of the 2009 Nike annual report below. You can navigate through the pages in the report by either clicking on the pages listed below, or by using the keyword search tool below to find specific information within the annual report.-
 1
1 -
2
-
3
-
4
-
5
-
6
-
7
-
8
-
9
-
10
-
11
-
12
-
13
-
14
-
15
-
16
-
17
-
 18
18 -
 19
19 -
 20
20 -
 21
21 -
 22
22 -
 23
23 -
 24
24 -
 25
25 -
 26
26 -
 27
27 -
 28
28 -
 29
29 -
 30
30 -
 31
31 -
 32
32 -
 33
33 -
 34
34 -
 35
35 -
 36
36 -
 37
37 -
 38
38 -
39
-
40
-
41
-
42
-
43
-
44
-
45
-
46
-
47
-
48
-
49
-
50
-
51
-
52
-
53
-
54
-
55
-
56
-
57
-
58
-
59
-
60
-
61
-
62
-
63
-
64
-
65
-
66
-
67
-
68
-
69
-
70
-
71
-
72
-
73
-
74
-
75
-
76
-
77
-
78
-
79
-
80
-
81
-
82
-
83
-
84
-
85
-
86
-
87
-
88
-
89
-
90
-
91
-
92
-
93
-
94
-
95
-
96
-
97
-
98
-
99
-
100
-
101
-
102
-
103
-
104
-
105
 |
 |

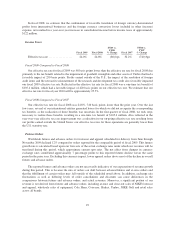
By product group, worldwide NIKE brand footwear revenue grew 14% and contributed more than $1.2
billion of incremental revenue for fiscal 2008. Worldwide NIKE branded apparel and equipment businesses
reported revenue growth of 14% and 6% for the year, respectively, and combined added approximately $750
million of incremental revenue in fiscal 2008. Our Other businesses reported revenue growth of 17% and
combined added more than $360 million of incremental revenue.
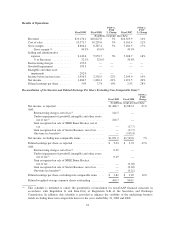
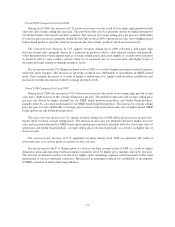
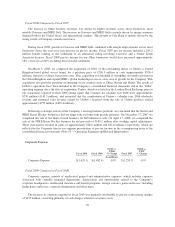
Gross Margin
Fiscal 2009 Fiscal 2008
FY09 vs.
FY08
% Change Fiscal 2007
FY08 vs.
FY07
% Change
(In millions)
Gross Margin ................... $8,604.4 $8,387.4 3% $7,160.5 17%
Gross Margin % ............. 44.9% 45.0% (10 bps) 43.9% 110 bps
Fiscal 2009 Compared to Fiscal 2008
During fiscal 2009, the primary factors contributing to the 10 basis point decline in consolidated gross
margin percentage versus the prior year were lower gross pricing margins and increased discounts which, when
combined, decreased consolidated gross margins by approximately 60 basis points. This decrease was partially
offset by improved hedge rates relative to the prior year, primarily in the Europe, Middle East and Africa
(“EMEA”) Region. Gross pricing margins were lower, primarily driven by higher product input costs, most
notably for footwear products. Higher levels of discounts were provided across all businesses in fiscal 2009 to
manage inventory levels.
We anticipate our gross margins in fiscal 2010 will be negatively impacted by hedge rates that are
unfavorable in comparison to the prior year.
Fiscal 2008 Compared to Fiscal 2007
During fiscal 2008, the primary factors contributing to the 110 basis point increase in the consolidated gross
margin percentage versus the prior year included: higher footwear in-line gross pricing margins, most notably in
the U.S. Region, primarily due to strategic price increases; improved currency hedge rates relative to the prior
year, primarily in the EMEA Region; and higher footwear close-out net pricing margins, most notably in the
EMEA Region, primarily due to better inventory management. The factors driving an increased gross margin
percentage were partially offset by lower apparel in-line gross pricing margins primarily driven by higher
product costs, most notably in the U.S. and EMEA regions, and increased apparel close-out sales, primarily in the
U.S. Region.
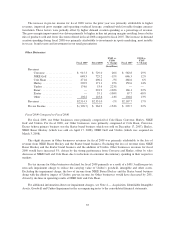
Selling and Administrative Expense
Fiscal 2009 Fiscal 2008
FY09 vs.
FY08
% Change Fiscal 2007
FY08 vs.
FY07
% Change
(In millions)
Operating overhead expense ........ $3,798.2 $3,645.4 4% $3,116.3 17%
Demand creation expense(1) ........ 2,351.4 2,308.3 2% 1,912.4 21%
Selling and administrative
expense .................. $6,149.6 $5,953.7 3% $5,028.7 18%
% of Revenues .......... 32.1% 32.0% 10 bps 30.8% 120 bps
(1) Demand creation consists of advertising and promotion expenses, including costs of endorsement contracts.
26