Nike 2009 Annual Report Download - page 34
Download and view the complete annual report
Please find page 34 of the 2009 Nike annual report below. You can navigate through the pages in the report by either clicking on the pages listed below, or by using the keyword search tool below to find specific information within the annual report.-
 1
1 -
2
-
3
-
4
-
5
-
6
-
7
-
8
-
9
-
10
-
11
-
12
-
13
-
14
-
15
-
16
-
17
-
18
-
19
-
20
-
21
-
22
-
23
-
 24
24 -
 25
25 -
 26
26 -
 27
27 -
 28
28 -
 29
29 -
 30
30 -
 31
31 -
 32
32 -
 33
33 -
 34
34 -
 35
35 -
 36
36 -
 37
37 -
 38
38 -
 39
39 -
 40
40 -
 41
41 -
 42
42 -
 43
43 -
 44
44 -
45
-
46
-
47
-
48
-
49
-
50
-
51
-
52
-
53
-
54
-
55
-
56
-
57
-
58
-
59
-
60
-
61
-
62
-
63
-
64
-
65
-
66
-
67
-
68
-
69
-
70
-
71
-
72
-
73
-
74
-
75
-
76
-
77
-
78
-
79
-
80
-
81
-
82
-
83
-
84
-
85
-
86
-
87
-
88
-
89
-
90
-
91
-
92
-
93
-
94
-
95
-
96
-
97
-
98
-
99
-
100
-
101
-
102
-
103
-
104
-
105
 |
 |

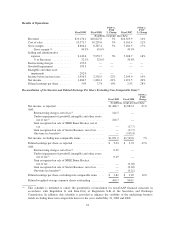
EMEA Region
Fiscal 2009 Fiscal 2008
FY09 vs.
FY08
% Change Fiscal 2007
FY08 vs.
FY07
% Change
(In millions)
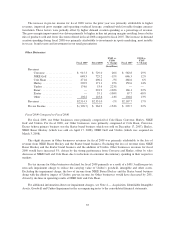
Revenues
Footwear ................... $3,136.7 $3,112.6 1% $2,608.0 19%
Apparel .................... 1,970.2 2,083.5 -5% 1,757.2 19%
Equipment .................. 405.3 433.1 -6% 398.9 9%
Total Revenues .......... $5,512.2 $5,629.2 -2% $4,764.1 18%
Pre-tax Income .................. $1,316.9 $1,281.9 3% $1,050.1 22%
Fiscal 2009 Compared to Fiscal 2008
For the EMEA Region, changes in currency exchange rates negatively impacted revenue growth by
approximately 2 percentage points in fiscal 2009. Excluding changes in currency exchange rates, a number of
markets within the region experienced lower revenues, reflecting a more difficult retail environment in these
markets. The U.K. remained flat for fiscal 2009 while the emerging markets in the region grew 14%, driven by
stronger results in Russia during the first half of fiscal 2009. These results were offset by lower revenues in
Southern European markets, including Spain, Italy and France.
Excluding changes in exchange rates, footwear revenues increased 4 percentage points during fiscal 2009.
The increase in footwear revenue was attributable to mid single-digit growth in unit sales, partially offset by a
low single-digit decrease in the average selling price per pair. The growth in unit sales was driven primarily by
higher demand for NIKE brand sportswear and kids’ products. The decrease in average selling price per pair was
mainly attributable to higher customer discounts and a shift in product mix to lower priced product models, most
notably higher volume of kids’ products.
On a currency neutral basis, EMEA apparel revenue decreased 4 percentage points during fiscal 2009,
primarily driven by lower average selling prices resulting from a higher mix of close-out sales and higher levels
of discounts provided retailers to manage inventory levels, which more than offset a mid single-digit increase in
unit sales.
The year-over-year increase in pre-tax income for the EMEA Region during fiscal 2009 was primarily
driven by a higher gross margin percentage, partially offset by slightly higher selling and administrative expenses
as a percentage of revenues. The gross margin improvement in fiscal 2009 was primarily attributable to improved
year-over-year currency hedge rates which more than offset higher warehousing costs and discounts on in-line
products. The increase in selling and administrative expenses was mainly driven by retail expansion across the
region.
Fiscal 2008 Compared to Fiscal 2007
For the EMEA Region, changes in currency exchange rates contributed 11 percentage points of the revenue
growth during fiscal 2008. Nearly all markets within the region increased revenues during the year. The
emerging markets in the region grew nearly 25%, driven by strong results in Russia, Turkey and South Africa.
Increases in Northern Europe and the U.K. also contributed significantly to the revenue growth.
Excluding changes in exchange rates, footwear revenues increased 8 percentage points during fiscal 2008
compared to the prior year. The increase in footwear revenue was attributable to double-digit growth in unit
sales, partially offset by a low single-digit decrease in the average selling price per pair. The growth in unit sales
was driven primarily by higher demand for our NIKE brand soccer and sportswear products. The decrease in
32