Nike 2009 Annual Report Download - page 33
Download and view the complete annual report
Please find page 33 of the 2009 Nike annual report below. You can navigate through the pages in the report by either clicking on the pages listed below, or by using the keyword search tool below to find specific information within the annual report.-
 1
1 -
2
-
3
-
4
-
5
-
6
-
7
-
8
-
9
-
10
-
11
-
12
-
13
-
14
-
15
-
16
-
17
-
18
-
19
-
20
-
21
-
22
-
 23
23 -
 24
24 -
 25
25 -
 26
26 -
 27
27 -
 28
28 -
 29
29 -
 30
30 -
 31
31 -
 32
32 -
 33
33 -
 34
34 -
 35
35 -
 36
36 -
 37
37 -
 38
38 -
 39
39 -
 40
40 -
 41
41 -
 42
42 -
 43
43 -
44
-
45
-
46
-
47
-
48
-
49
-
50
-
51
-
52
-
53
-
54
-
55
-
56
-
57
-
58
-
59
-
60
-
61
-
62
-
63
-
64
-
65
-
66
-
67
-
68
-
69
-
70
-
71
-
72
-
73
-
74
-
75
-
76
-
77
-
78
-
79
-
80
-
81
-
82
-
83
-
84
-
85
-
86
-
87
-
88
-
89
-
90
-
91
-
92
-
93
-
94
-
95
-
96
-
97
-
98
-
99
-
100
-
101
-
102
-
103
-
104
-
105
 |
 |
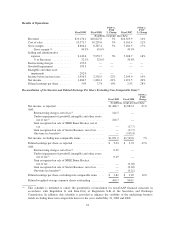
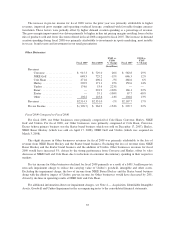
Fiscal 2009 Compared to Fiscal 2008
During fiscal 2009, the increase in U.S. footwear revenue was the result of low-single digit growth in both
unit sales and average selling price per pair. The growth in unit sales was primarily driven by higher demand for
our Jordan brand, action sports and kids’ products. The increase in average selling price per pair was attributable
to selective price increases, primarily during the first half of fiscal 2009, and increased sales mix of higher priced
Jordan brand products, partially offset by increased sales mix of kids’ products which are lower priced.
The year-over-year decrease in U.S. apparel revenues during fiscal 2009 reflected a mid-single digit
decrease in unit sales, primarily driven by a reduction in products sold to value channel retailers and generally
softer demand in the overall apparel market. Average selling prices increased slightly as a result of the reduction
in products sold to value retailers, mostly offset by an increased mix of close-out sales and higher levels of
discounts provided retailers to manage inventory levels.
Pre-tax income for the U.S. Region declined in fiscal 2009 as a result of higher operating overhead expenses
and lower gross margins. The increase in operating overhead was attributable to investments in NIKE-owned
retail. Gross margins decreased as a result of higher warehousing costs, higher retail inventory markdowns and
increased customer discounts provided to manage inventory levels.
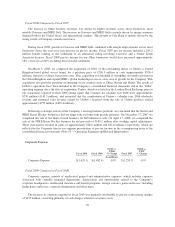
Fiscal 2008 Compared to Fiscal 2007
During fiscal 2008, the increase in U.S. footwear revenue was the result of low-single digit growth in unit
sales and a slight increase in the average selling price per pair. The growth in unit sales and average selling price
per pair was driven by higher demand for our NIKE brand sportswear products and Jordan brand products,
partially offset by a decrease in demand for our NIKE brand basketball products. The increase in average selling
price per pair was also attributable to strategic price increases and an increased sales mix of higher priced NIKE
brand sportswear and Jordan brand products.
The year-over-year increase in U.S. apparel revenues during fiscal 2008 reflected an increase in unit sales,
mostly offset by lower average selling prices. The increase in unit sales was primarily driven by higher close-out
sales and increased demand for NIKE brand sports performance products, partially offset by lower unit sales of
sportswear and Jordan brand products. Average selling prices decreased primarily as a result of a higher mix of
close-out sales.
The year-over-year decrease in U.S. equipment revenues during fiscal 2008 was primarily the result of
lower unit sales of accessory products and fewer close-out sales.
Pre-tax income for the U.S. Region grew at a slower rate than revenue in fiscal 2008 as a result of higher
demand creation and operating overhead expenses, partially offset by higher gross margins, driven by footwear.
The increase in demand creation was driven by higher sports marketing expenses and investments in the retail
presentation of our key wholesale customers. The increase in operating overhead was attributable to investments
in NIKE-owned retail and normal wage inflation.
31