Nike 2009 Annual Report Download - page 78
Download and view the complete annual report
Please find page 78 of the 2009 Nike annual report below. You can navigate through the pages in the report by either clicking on the pages listed below, or by using the keyword search tool below to find specific information within the annual report.-
 1
1 -
2
-
3
-
4
-
5
-
6
-
7
-
8
-
9
-
10
-
11
-
12
-
13
-
14
-
15
-
16
-
17
-
18
-
19
-
20
-
21
-
22
-
23
-
24
-
25
-
26
-
27
-
28
-
29
-
30
-
31
-
32
-
33
-
34
-
35
-
36
-
37
-
38
-
39
-
40
-
41
-
42
-
43
-
44
-
45
-
46
-
47
-
48
-
49
-
50
-
51
-
52
-
53
-
54
-
55
-
56
-
57
-
58
-
59
-
60
-
61
-
62
-
63
-
64
-
65
-
66
-
67
-
 68
68 -
 69
69 -
 70
70 -
 71
71 -
 72
72 -
 73
73 -
 74
74 -
 75
75 -
 76
76 -
 77
77 -
 78
78 -
 79
79 -
 80
80 -
 81
81 -
 82
82 -
 83
83 -
 84
84 -
 85
85 -
 86
86 -
 87
87 -
 88
88 -
89
-
90
-
91
-
92
-
93
-
94
-
95
-
96
-
97
-
98
-
99
-
100
-
101
-
102
-
103
-
104
-
105
 |
 |

NIKE, INC.
NOTES TO CONSOLIDATED FINANCIAL STATEMENTS — (Continued)
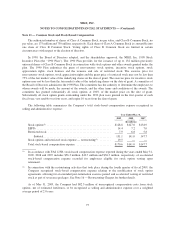
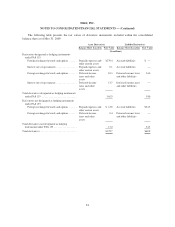
The weighted average fair value per share of the options granted during the years ended May 31, 2009, 2008
and 2007, as computed using the Black-Scholes pricing model, was $17.13, $13.87 and $8.80, respectively. The
weighted average assumptions used to estimate these fair values are as follows:
Year Ended May 31,
2009 2008 2007
Dividend yield ................................................... 1.5% 1.4% 1.6%
Expected volatility ................................................ 32.5% 20.0% 19.0%
Weighted average expected life (in years) .............................. 5.0 5.0 5.0
Risk-free interest rate .............................................. 3.4% 4.8% 5.0%
The Company estimates the expected volatility based on the implied volatility in market traded options on
the Company’s common stock with a term greater than one year, along with other factors. The weighted average
expected life of options is based on an analysis of historical and expected future exercise patterns. The interest
rate is based on the U.S. Treasury (constant maturity) risk-free rate in effect at the date of grant for periods
corresponding with the expected term of the options.
The following summarizes the stock option transactions under the plan discussed above:
Shares
Weighted
Average
Option
Price
(In millions)
Options outstanding May 31, 2006 .................................. 40.4 $32.31
Exercised .................................................. (10.7) 27.55
Forfeited .................................................. (1.6) 37.17
Granted ................................................... 11.6 39.54
Options outstanding May 31, 2007 .................................. 39.7 $35.50
Exercised .................................................. (9.1) 33.45
Forfeited .................................................. (0.9) 44.44
Granted ................................................... 6.9 58.50
Options outstanding May 31, 2008 .................................. 36.6 $40.14
Exercised .................................................. (4.0) 35.70
Forfeited .................................................. (1.3) 51.19
Granted ................................................... 7.5 58.17
Options outstanding May 31, 2009 .................................. 38.8 $43.69
Options exercisable at May 31,
2007 ...................................................... 15.3 $29.52
2008 ...................................................... 16.2 32.35
2009 ...................................................... 21.4 36.91
The weighted average contractual life remaining for options outstanding and options exercisable at May 31,
2009 was 6.3 years and 5.0 years, respectively. The aggregate intrinsic value for options outstanding and
exercisable at May 31, 2009 was $535.6 million and $433.5 million, respectively. The aggregate intrinsic value
was the amount by which the market value of the underlying stock exceeded the exercise price of the options.
The total intrinsic value of the options exercised during the years ended May 31, 2009, 2008 and 2007 was
$108.4 million, $259.4 million and $204.9 million, respectively.
76