Nike 2009 Annual Report Download - page 32
Download and view the complete annual report
Please find page 32 of the 2009 Nike annual report below. You can navigate through the pages in the report by either clicking on the pages listed below, or by using the keyword search tool below to find specific information within the annual report.-
 1
1 -
2
-
3
-
4
-
5
-
6
-
7
-
8
-
9
-
10
-
11
-
12
-
13
-
14
-
15
-
16
-
17
-
18
-
19
-
20
-
21
-
 22
22 -
 23
23 -
 24
24 -
 25
25 -
 26
26 -
 27
27 -
 28
28 -
 29
29 -
 30
30 -
 31
31 -
 32
32 -
 33
33 -
 34
34 -
 35
35 -
 36
36 -
 37
37 -
 38
38 -
 39
39 -
 40
40 -
 41
41 -
 42
42 -
43
-
44
-
45
-
46
-
47
-
48
-
49
-
50
-
51
-
52
-
53
-
54
-
55
-
56
-
57
-
58
-
59
-
60
-
61
-
62
-
63
-
64
-
65
-
66
-
67
-
68
-
69
-
70
-
71
-
72
-
73
-
74
-
75
-
76
-
77
-
78
-
79
-
80
-
81
-
82
-
83
-
84
-
85
-
86
-
87
-
88
-
89
-
90
-
91
-
92
-
93
-
94
-
95
-
96
-
97
-
98
-
99
-
100
-
101
-
102
-
103
-
104
-
105
 |
 |

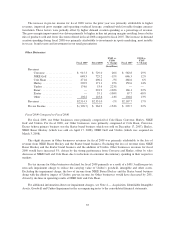
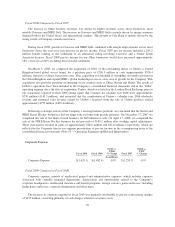
Operating Segments
The breakdown of revenues follows:
Fiscal 2009 Fiscal 2008(1)
FY09 vs.
FY08
% Change Fiscal 2007(1)
FY08 vs.
FY07
% Change
(In millions)
U.S. Region .................. $ 6,542.9 $ 6,414.5 2% $ 6,131.7 5%
EMEA Region ................ 5,512.2 5,629.2 -2% 4,764.1 18%
Asia Pacific Region ............ 3,322.0 2,887.6 15% 2,295.7 26%
Americas Region .............. 1,284.7 1,164.7 10% 966.7 20%
Total NIKE Brand Revenues .... 16,661.8 16,096.0 4% 14,158.2 14%
Other ....................... 2,514.3 2,531.0 -1% 2,167.7 17%
Total NIKE, Inc. Revenues ...... $19,176.1 $18,627.0 3% $16,325.9 14%
(1) Certain prior year amounts have been reclassified to conform to fiscal year 2009 presentation. These
changes had no impact on previously reported results of operations or shareholders’ equity.
The breakdown of income before income taxes (“pre-tax income”) follows:
Fiscal 2009 Fiscal 2008(1)
FY09 vs.
FY08
% Change Fiscal 2007(1)
FY08 vs.
FY07
% Change
(In millions)
U.S. Region .................. $1,337.9 $ 1,402.0 -5% $ 1,386.1 1%
EMEA Region ................ 1,316.9 1,281.9 3% 1,050.1 22%
Asia Pacific Region ............ 853.4 694.2 23% 515.4 35%
Americas Region .............. 274.1 242.3 13% 199.3 22%
Other ....................... (196.7) 364.9 -154% 299.7 22%
Corporate Expense ............. (1,629.1) (1,482.4) -10% (1,250.7) -19%
Total Pre-tax Income ........... $1,956.5 $ 2,502.9 -22% $ 2,199.9 14%
(1) Certain prior year amounts have been reclassified to conform to fiscal year 2009 presentation. These
changes had no impact on previously reported results of operations or shareholders’ equity.
The following discussion includes disclosure of pre-tax income for our operating segments. We have
reported pre-tax income for each of our operating segments in accordance with Statement of Financial
Accounting Standard (“SFAS”) No. 131, “Disclosures about Segments of an Enterprise and Related
Information.” As discussed in Note 19 — Operating Segments and Related Information in the accompanying
notes to the consolidated financial statements, certain corporate costs are not included in pre-tax income of our
operating segments.
U.S. Region
Fiscal 2009 Fiscal 2008
FY09 vs.
FY08
% Change Fiscal 2007
FY08 vs.
FY07
% Change
(In millions)
Revenues
Footwear ................... $4,550.8 $4,326.8 5% $4,067.2 6%
Apparel .................... 1,664.4 1,745.1 -5% 1,716.1 2%
Equipment .................. 327.7 342.6 -4% 348.4 -2%
Total Revenues .......... $6,542.9 $6,414.5 2% $6,131.7 5%
Pre-tax Income .................. $1,337.9 $1,402.0 -5% $1,386.1 1%
30