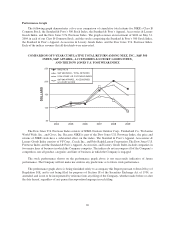
Nike 2009 Annual Report Download - page 29
Download and view the complete annual report
Please find page 29 of the 2009 Nike annual report below. You can navigate through the pages in the report by either clicking on the pages listed below, or by using the keyword search tool below to find specific information within the annual report.-
 1
1 -
2
-
3
-
4
-
5
-
6
-
7
-
8
-
9
-
10
-
11
-
12
-
13
-
14
-
15
-
16
-
17
-
18
-
 19
19 -
 20
20 -
 21
21 -
 22
22 -
 23
23 -
 24
24 -
 25
25 -
 26
26 -
 27
27 -
 28
28 -
 29
29 -
 30
30 -
 31
31 -
 32
32 -
 33
33 -
 34
34 -
 35
35 -
 36
36 -
 37
37 -
 38
38 -
 39
39 -
40
-
41
-
42
-
43
-
44
-
45
-
46
-
47
-
48
-
49
-
50
-
51
-
52
-
53
-
54
-
55
-
56
-
57
-
58
-
59
-
60
-
61
-
62
-
63
-
64
-
65
-
66
-
67
-
68
-
69
-
70
-
71
-
72
-
73
-
74
-
75
-
76
-
77
-
78
-
79
-
80
-
81
-
82
-
83
-
84
-
85
-
86
-
87
-
88
-
89
-
90
-
91
-
92
-
93
-
94
-
95
-
96
-
97
-
98
-
99
-
100
-
101
-
102
-
103
-
104
-
105
 |
 |
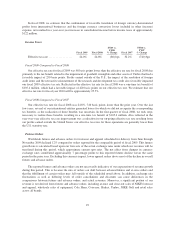
Fiscal 2009 Compared to Fiscal 2008
Changes in foreign currency exchange rates decreased selling and administrative expense by 2 percentage
points in fiscal 2009. Excluding changes in exchange rates, operating overhead increased 6% during fiscal 2009.
The increase in operating overhead in fiscal 2009 was primarily attributable to investments in growth drivers
such as NIKE-owned retail in the U.S., EMEA and Asia Pacific regions, infrastructure for emerging markets in
the EMEA and Asia Pacific regions and non-NIKE brand businesses, which more than offset the steps taken to
reduce operating overhead spending including implementation of a hiring freeze and reductions in spending for
travel and meetings.
On a constant-currency basis, demand creation expense increased 3% during fiscal 2009. Demand creation
spending decreased in the second half of fiscal 2009 as a result of actions taken to reduce spending across nearly
all demand creation related activities, most notably traditional media and print advertising. The increase in
demand creation the first half of fiscal 2009 was primarily attributable to strategic investments in demand
creation, including first quarter spending around the Beijing Summer Olympics and the European Football
Championships, and increased investments in athlete and team endorsements across all regions.
In fiscal 2010, we intend to reduce selling and administrative spending while shifting resources to fund
initiatives that are critical to the achievement of our long-term growth goals. We expect our selling and
administrative expenses to decline in the first half of fiscal 2010 compared to the same period in the prior year,
reflecting both lower operating overhead and demand creation spending, with the latter driven partially by the
comparison to the significant prior year demand creation investment around the Beijing Summer Olympics and
European Football Championships. Future selling and administrative expense may vary from our current
expectations due to changes in the rapidly evolving macroeconomic environment and our reaction to those
changes.
Fiscal 2008 Compared to Fiscal 2007
In fiscal 2008, selling and administrative expenses increased as a percentage of revenues by 120 basis
points, driven primarily by strategic investments in both demand creation and operating overhead. Changes in
currency exchange rates increased selling and administrative expense growth by 4 percentage points.
On a constant-currency basis, demand creation expense increased 15% versus the prior year. The year-over-
year increase was primarily attributable to investments in athlete and sport team endorsers of our products,
spending around major sporting events including the European Football Championships and the Beijing Summer
Olympics, key product initiatives such as Men’s Training in the U.S. and retail presentation.
Excluding the effects of changes in exchange rates, operating overhead increased 14% versus the prior year.
The increase in operating overhead was attributable to investments in growth drivers such as NIKE-owned retail,
non-NIKE brand businesses, emerging markets and normal wage inflation and performance-based compensation.
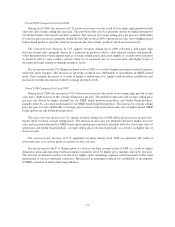
Restructuring Charges
During the fourth quarter of fiscal 2009, we executed a plan to restructure the organization to streamline our
management structure, enhance consumer focus, drive innovation more quickly to market and establish a more
scalable cost structure. As a result of these actions, we reduced our global workforce by approximately 5% and
incurred pre-tax restructuring charges of $195 million, primarily consisting of cash charges related to severance
costs. These charges are included in our “Corporate” category for segment reporting purposes.
Goodwill, Intangible and Other Asset Impairment
In the third quarter of fiscal 2009, we recognized a $401.3 million pre-tax non-cash impairment charge to
reduce the carrying value of Umbro’s goodwill, intangible and other assets. Although Umbro’s financial
27