Nike 2009 Annual Report Download - page 88
Download and view the complete annual report
Please find page 88 of the 2009 Nike annual report below. You can navigate through the pages in the report by either clicking on the pages listed below, or by using the keyword search tool below to find specific information within the annual report.-
 1
1 -
2
-
3
-
4
-
5
-
6
-
7
-
8
-
9
-
10
-
11
-
12
-
13
-
14
-
15
-
16
-
17
-
18
-
19
-
20
-
21
-
22
-
23
-
24
-
25
-
26
-
27
-
28
-
29
-
30
-
31
-
32
-
33
-
34
-
35
-
36
-
37
-
38
-
39
-
40
-
41
-
42
-
43
-
44
-
45
-
46
-
47
-
48
-
49
-
50
-
51
-
52
-
53
-
54
-
55
-
56
-
57
-
58
-
59
-
60
-
61
-
62
-
63
-
64
-
65
-
66
-
67
-
68
-
69
-
70
-
71
-
72
-
73
-
74
-
75
-
76
-
77
-
 78
78 -
 79
79 -
 80
80 -
 81
81 -
 82
82 -
 83
83 -
 84
84 -
 85
85 -
 86
86 -
 87
87 -
 88
88 -
 89
89 -
 90
90 -
 91
91 -
 92
92 -
 93
93 -
 94
94 -
 95
95 -
 96
96 -
 97
97 -
 98
98 -
99
-
100
-
101
-
102
-
103
-
104
-
105
 |
 |

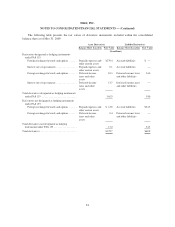
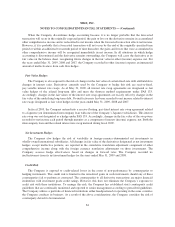
NIKE, INC.
NOTES TO CONSOLIDATED FINANCIAL STATEMENTS — (Continued)
Year Ended May 31,
2009 2008 2007
(In millions)
Net Revenue
United States ................................... $ 6,542.9 $ 6,414.5 $ 6,131.7
Europe, Middle East and Africa .................... 5,512.2 5,629.2 4,764.1
Asia Pacific .................................... 3,322.0 2,887.6 2,295.7
Americas ...................................... 1,284.7 1,164.7 966.7
Other ......................................... 2,514.3 2,531.0 2,167.7
$19,176.1 $18,627.0 $16,325.9
Pre-tax Income
United States ................................... $ 1,337.9 $ 1,402.0 $ 1,386.1
Europe, Middle East and Africa .................... 1,316.9 1,281.9 1,050.1
Asia Pacific .................................... 853.4 694.2 515.4
Americas ...................................... 274.1 242.3 199.3
Other(1) ........................................ (196.7) 364.9 299.7
Corporate Expense(2) ............................. (1,629.1) (1,482.4) (1,250.7)
$ 1,956.5 $ 2,502.9 $ 2,199.9
Additions to Long-lived Assets
United States ................................... $ 95.2 $ 138.4 $ 67.3
Europe, Middle East and Africa .................... 77.7 69.0 94.9
Asia Pacific .................................... 74.8 42.4 20.7
Americas ...................................... 8.7 8.6 5.3
Other ......................................... 89.6 61.5 36.0
Corporate ...................................... 109.7 129.3 89.3
$ 455.7 $ 449.2 $ 313.5
Depreciation
United States ................................... $ 61.4 $ 49.2 $ 45.4
Europe, Middle East and Africa .................... 55.4 64.8 47.4
Asia Pacific .................................... 43.6 31.1 25.2
Americas ...................................... 6.5 6.7 6.1
Other ......................................... 37.5 28.1 28.2
Corporate ...................................... 130.6 123.7 117.4
$ 335.0 $ 303.6 $ 269.7
(1) During the year ended May 31, 2009, the Other category included a pre-tax charge of $401.3 million for the
impairment of goodwill, intangible and other assets of Umbro, which was recorded in the third quarter of
fiscal 2009. See Note 4 — Acquisition, Identifiable Intangible Assets, Goodwill and Umbro Impairment for
more information.
(2) During the year ended May 31, 2009, Corporate expense included pre-tax charges of $195.0 million for the
Company’s restructuring activities, which were completed in the fourth quarter of fiscal 2009. See
Note 16 — Restructuring Charges for more information.
86