Nike 2009 Annual Report Download - page 36
Download and view the complete annual report
Please find page 36 of the 2009 Nike annual report below. You can navigate through the pages in the report by either clicking on the pages listed below, or by using the keyword search tool below to find specific information within the annual report.-
 1
1 -
2
-
3
-
4
-
5
-
6
-
7
-
8
-
9
-
10
-
11
-
12
-
13
-
14
-
15
-
16
-
17
-
18
-
19
-
20
-
21
-
22
-
23
-
24
-
25
-
 26
26 -
 27
27 -
 28
28 -
 29
29 -
 30
30 -
 31
31 -
 32
32 -
 33
33 -
 34
34 -
 35
35 -
 36
36 -
 37
37 -
 38
38 -
 39
39 -
 40
40 -
 41
41 -
 42
42 -
 43
43 -
 44
44 -
 45
45 -
 46
46 -
47
-
48
-
49
-
50
-
51
-
52
-
53
-
54
-
55
-
56
-
57
-
58
-
59
-
60
-
61
-
62
-
63
-
64
-
65
-
66
-
67
-
68
-
69
-
70
-
71
-
72
-
73
-
74
-
75
-
76
-
77
-
78
-
79
-
80
-
81
-
82
-
83
-
84
-
85
-
86
-
87
-
88
-
89
-
90
-
91
-
92
-
93
-
94
-
95
-
96
-
97
-
98
-
99
-
100
-
101
-
102
-
103
-
104
-
105
 |
 |

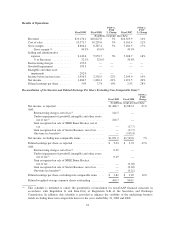
Fiscal 2008 Compared to Fiscal 2007
In the Asia Pacific Region, changes in currency exchange rates contributed 6 percentage points of revenue
growth for fiscal 2008. Nearly all countries across the region delivered revenue growth on a currency neutral
basis. China continues to be the primary driver of growth within the region as fiscal 2008 revenues increased
50% on a currency-neutral basis, driven by the expansion in both the number of stores selling NIKE products and
sales through existing stores. Constant-currency revenues in Japan increased 2% during fiscal 2008.
Footwear revenue growth for fiscal 2008 reflected increased unit sales, most notably in China, partially
offset by lower average selling prices driven primarily by a shift in mix from higher priced to lower priced
models. The year-over-year increase in apparel revenue was driven by increased demand in China.
The increase in pre-tax income for the Asia Pacific Region for fiscal 2008 was driven by higher revenues,
improved gross margins and favorable foreign currency translation, which more than offset slightly higher selling
and administrative expenses as a percentage of revenue. The gross margin improvement versus the prior year was
primarily driven by reduced warehousing costs, improved year-over-year standard currency rates and improved
margins on close-out product. The increase in selling and administrative expenses during fiscal 2008 was
primarily attributable to spending around the Beijing Summer Olympics. Overall business growth across the
region combined with retail expansion, primarily in China, also contributed to an increase in operating overhead
expenses, which grew slightly slower than revenues.
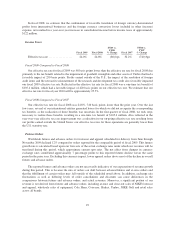
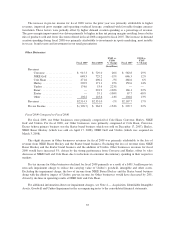
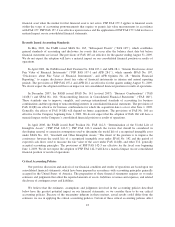
Americas Region
Fiscal 2009 Fiscal 2008
FY09 vs.
FY08
% Change Fiscal 2007
FY08 vs.
FY07
% Change
(In millions)
Revenues
Footwear ................... $ 892.1 $ 792.7 13% $679.6 17%
Apparel .................... 287.8 265.4 8% 193.9 37%
Equipment .................. 104.8 106.6 -2% 93.2 14%
Total Revenues .......... $1,284.7 $1,164.7 10% $966.7 20%
Pre-tax Income .................. $ 274.1 $ 242.3 13% $199.3 22%
Fiscal 2009 Compared to Fiscal 2008
In the Americas Region, changes in currency exchange rates negatively impacted revenue growth by
approximately 9 percentage points in fiscal 2009. Excluding changes in foreign currency exchange rates, the
Americas Region reported growth in all markets, led by Brazil, Argentina and Mexico.
The increase in pre-tax income for fiscal 2009 was primarily attributable to higher revenues and selling and
administrative expense leverage, which more than offset lower gross margins. Selling and administrative
expenses were higher than fiscal 2008, but represented a lower percentage of revenues for fiscal 2009. The
increase in selling and administrative expense was due to increases in both demand creation and operating
overhead expenses mainly driven by spending around retail marketing programs, brand events and normal wage
inflation. The slight decrease in gross margin percentage in fiscal 2009 was mainly due to a higher sales mix of
lower margin footwear products and higher import costs, which more than offset improved year-on-year standard
foreign currency rates.
Fiscal 2008 Compared to Fiscal 2007
In the Americas Region, changes in currency exchange rates contributed 7 percentage points of revenue
growth for fiscal 2008. Excluding changes in foreign currency exchange rates, the Americas Region reported
growth in all markets, led by Argentina, Mexico and Brazil.
34