Nike 2015 Annual Report Download - page 19
Download and view the complete annual report
Please find page 19 of the 2015 Nike annual report below. You can navigate through the pages in the report by either clicking on the pages listed below, or by using the keyword search tool below to find specific information within the annual report.-
 1
1 -
2
-
3
-
4
-
5
-
6
-
7
-
8
-
 9
9 -
 10
10 -
 11
11 -
 12
12 -
 13
13 -
 14
14 -
 15
15 -
 16
16 -
 17
17 -
 18
18 -
 19
19 -
 20
20 -
 21
21 -
 22
22 -
 23
23 -
 24
24 -
 25
25 -
 26
26 -
 27
27 -
 28
28 -
 29
29 -
30
-
31
-
32
-
33
-
34
-
35
-
36
-
37
-
38
-
39
-
40
-
41
-
42
-
43
-
44
-
45
-
46
-
47
-
48
-
49
-
50
-
51
-
52
-
53
-
54
-
55
-
56
-
57
-
58
-
59
-
60
-
61
-
62
-
63
-
64
-
65
-
66
-
67
-
68
-
69
-
70
-
71
-
72
-
73
-
74
-
75
-
76
-
77
-
78
-
79
-
80
-
81
-
82
-
83
-
84
-
85
-
86
-
87
 |
 |

PART II
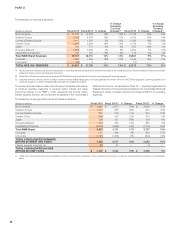
ITEM 6. Selected Financial Data
Unless otherwise indicated, the following disclosures reflect the Company’s continuing operations; refer to Note 15 — Discontinued Operations in the
accompanying Notes to the Consolidated Financial Statements for additional information regarding discontinued operations. All per share amounts are reflective
of the two-for-one stock split that began trading at the split-adjusted price on December 26, 2012.
(Dollars in millions, except per share data and financial ratios)
Financial History
2015 2014 2013 2012 2011
Year Ended May 31,
Revenues $ 30,601 $ 27,799 $ 25,313 $ 23,331 $ 20,117
Gross profit 14,067 12,446 11,034 10,148 9,202
Gross margin % 46.0% 44.8% 43.6% 43.5% 45.7%
Net income from continuing operations 3,273 2,693 2,451 2,257 2,163
Net income (loss) from discontinued operations — — 21 (46) (39)
Net income 3,273 2,693 2,472 2,211 2,124
Earnings per common share from continuing operations:
Basic 3.80 3.05 2.74 2.45 2.27
Diluted 3.70 2.97 2.68 2.40 2.23
Earnings per common share from discontinued operations:
Basic — — 0.02 (0.05) (0.04)
Diluted — — 0.02 (0.05) (0.04)
Weighted average common shares outstanding 861.7 883.4 897.3 920.0 951.1
Diluted weighted average common shares outstanding 884.4 905.8 916.4 939.6 971.3
Cash dividends declared per common share 1.08 0.93 0.81 0.70 0.60
Cash flow from operations, inclusive of discontinued
operations(1) 4,680 3,013 3,032 1,932 1,796
Price range of common stock:
High 105.50 80.26 65.91 57.20 46.15
Low 73.14 59.11 43.89 39.29 33.61
At May 31,
Cash and equivalents $ 3,852 $ 2,220 $ 3,337 $ 2,254 $ 1,877
Short-term investments 2,072 2,922 2,628 1,503 2,661
Inventories 4,337 3,947 3,484 3,251 2,630
Working capital, excluding assets and liabilities of
discontinued operations(2)(3) 9,642 8,669 9,686 7,531 7,275
Total assets, excluding assets of discontinued operations(2) 21,600 18,594 17,545 14,804 14,398
Long-term debt 1,079 1,199 1,210 228 276
Capital lease obligations(4) 57481——
Redeemable preferred stock 0.3 0.3 0.3 0.3 0.3
Shareholders’ equity 12,707 10,824 11,081 10,319 9,793
Year-end stock price 101.67 76.91 61.66 54.09 42.23
Market capitalization 87,044 66,921 55,124 49,546 39,523
Financial Ratios:
Return on equity 27.8% 24.6% 23.1% 22.0% 21.8%
Return on assets 16.3% 14.9% 15.3% 15.1% 15.0%
Inventory turns 4.0 4.1 4.2 4.5 4.8
Current ratio at May 31 2.5 2.7 3.5 3.0 2.9
Price/Earnings ratio at May 31 27.5 25.9 22.8 23.0 19.3
(1) Prior year amounts for fiscal 2014, 2013 and 2012 have been revised to correct immaterial misstatements as described in Note 1 — Summary of Significant Accounting Policies in the
accompanying Notes to the Consolidated Financial Statements.
(2) Assets of discontinued operations were $0 million, $0 million, $0 million, $615 million and $560 million for the years ended May 31, 2015, 2014, 2013, 2012 and 2011, respectively.
(3) Liabilities of discontinued operations were $0 million, $0 million, $18 million, $170 million and $184 million for the years ended May 31, 2015, 2014, 2013, 2012 and 2011, respectively.
(4) During the fiscal year ended May 31, 2015, the Company restructured the terms of certain capital leases, which now qualify as operating leases.
80