Nike 2015 Annual Report Download - page 25
Download and view the complete annual report
Please find page 25 of the 2015 Nike annual report below. You can navigate through the pages in the report by either clicking on the pages listed below, or by using the keyword search tool below to find specific information within the annual report.-
 1
1 -
2
-
3
-
4
-
5
-
6
-
7
-
8
-
9
-
10
-
11
-
12
-
13
-
14
-
 15
15 -
 16
16 -
 17
17 -
 18
18 -
 19
19 -
 20
20 -
 21
21 -
 22
22 -
 23
23 -
 24
24 -
 25
25 -
 26
26 -
 27
27 -
 28
28 -
 29
29 -
 30
30 -
 31
31 -
 32
32 -
 33
33 -
 34
34 -
 35
35 -
36
-
37
-
38
-
39
-
40
-
41
-
42
-
43
-
44
-
45
-
46
-
47
-
48
-
49
-
50
-
51
-
52
-
53
-
54
-
55
-
56
-
57
-
58
-
59
-
60
-
61
-
62
-
63
-
64
-
65
-
66
-
67
-
68
-
69
-
70
-
71
-
72
-
73
-
74
-
75
-
76
-
77
-
78
-
79
-
80
-
81
-
82
-
83
-
84
-
85
-
86
-
87
 |
 |

PART II
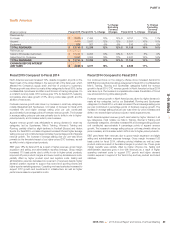
The reported futures orders growth is not necessarily indicative of our
expectation of revenue growth during this period. This is due to year-over-
year changes in shipment timing, changes in the mix of orders between
futures and at-once orders and because the fulfillment of certain orders may
fall outside of the schedule noted above. In addition, exchange rate
fluctuations as well as differing levels of order cancellations, discounts and
returns can cause differences in the comparisons between futures orders and
actual revenues. Moreover, a portion of our revenue is not derived from
futures orders, including sales of at-once and closeout NIKE Brand footwear
and apparel, sales of NIKE Brand equipment, sales from our DTC operations
and sales from Converse, NIKE Golf and Hurley.
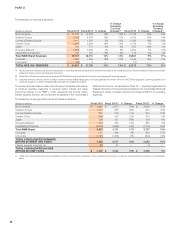
Gross Margin
(Dollars in millions) Fiscal 2015 Fiscal 2014 % Change Fiscal 2013 % Change
Gross profit $ 14,067 $ 12,446 13% $ 11,034 13%
Gross margin % 46.0% 44.8% 120 bps 43.6% 120 bps
Fiscal 2015 Compared to Fiscal 2014
For fiscal 2015, our consolidated gross margin was 120 basis points higher
than fiscal 2014, primarily driven by the following factors:
•Higher NIKE Brand average net selling prices (increasing gross margin
approximately 250 basis points) primarily attributable to shifts in mix to
higher-priced products and, to a lesser extent, increased prices, in part in
response to inflationary conditions in certain territories;
•Higher NIKE Brand product costs (decreasing gross margin approximately
190 basis points) largely due to shifts in mix to higher-cost products, labor
input cost inflation and higher air freight costs, in part to mitigate the
negative impacts from product delays due to the West Coast port
congestion in the United States;
•Growth in our higher-margin DTC business (increasing gross margin
approximately 40 basis points); and
•Changes in foreign currency exchange rates (including gains and losses on
hedge transactions) increased gross margin approximately 20 basis points.
Fiscal 2014 Compared to Fiscal 2013
For fiscal 2014, our consolidated gross margin was 120 basis points higher
than fiscal 2013, primarily driven by the following factors:
•Higher NIKE Brand average net selling prices (increasing gross margin
approximately 160 basis points) attributable to both shifts in mix to higher-
priced products and price increases;
•Higher NIKE Brand product costs (decreasing gross margin approximately
50 basis points), primarily due to shifts in mix to higher-cost products, as
well as labor input cost inflation;
•Growth in our higher-margin DTC business (increasing gross margin
approximately 40 basis points);
•Improved margins due to cleaner closeout inventories (increasing margin
approximately 20 basis points); and
•Unfavorable changes in foreign currency exchange rates, including hedges
(decreasing gross margin approximately 50 basis points).
Total Selling and Administrative Expense
(Dollars in millions) Fiscal 2015 Fiscal 2014 % Change Fiscal 2013 % Change
Demand creation expense(1) $ 3,213 $ 3,031 6% $ 2,745 10%
Operating overhead expense 6,679 5,735 16% 5,051 14%
Total selling and administrative
expense $ 9,892 $ 8,766 13% $ 7,796 12%
% of Revenues 32.3% 31.5% 80 bps 30.8% 70 bps
(1) Demand creation expense consists of advertising and promotion costs, including costs of endorsement contracts, television, digital and print advertising, brand events and retail brand
presentation.
Fiscal 2015 Compared to Fiscal 2014
Demand creation expense increased 6% for fiscal 2015 compared to the prior
year, primarily due to support for key brand and consumer events, including
the World Cup in early fiscal 2015, increased digital brand marketing,
investments in DTC marketing and higher sports marketing expense.
Changes in foreign currency exchange rates decreased growth in Demand
creation expense by approximately 4 percentage points for fiscal 2015.
Operating overhead expense increased 16% compared to the prior year,
primarily driven by investments in our rapidly growing DTC business, including
new store openings and higher variable expenses, investments in operational
infrastructure and consumer-focused digital capabilities and higher
performance-based compensation. For fiscal 2015, changes in foreign
currency exchange rates decreased growth in Operating overhead expense
by approximately 3 percentage points.
Fiscal 2014 Compared to Fiscal 2013
Demand creation expense increased 10% compared to the prior year, mainly
driven by marketing support for events, including the World Cup, higher
sports marketing expense, key product launches and initiatives and
investments to upgrade the presentation of our products in wholesale
accounts. For fiscal 2014, changes in foreign currency exchange rates did not
have a material impact on Demand creation expense.
Compared to the prior year, Operating overhead expense increased 14%,
primarily attributable to growth in our DTC business driven by new store
openings, higher personnel costs and e-commerce launches, as well as
increased investments in our digital capabilities and corporate infrastructure.
Changes in foreign currency exchange rates did not have a material impact on
Operating overhead expense for fiscal 2014.
86