Nike 2015 Annual Report Download - page 28
Download and view the complete annual report
Please find page 28 of the 2015 Nike annual report below. You can navigate through the pages in the report by either clicking on the pages listed below, or by using the keyword search tool below to find specific information within the annual report.-
 1
1 -
2
-
3
-
4
-
5
-
6
-
7
-
8
-
9
-
10
-
11
-
12
-
13
-
14
-
15
-
16
-
17
-
 18
18 -
 19
19 -
 20
20 -
 21
21 -
 22
22 -
 23
23 -
 24
24 -
 25
25 -
 26
26 -
 27
27 -
 28
28 -
 29
29 -
 30
30 -
 31
31 -
 32
32 -
 33
33 -
 34
34 -
 35
35 -
 36
36 -
 37
37 -
 38
38 -
39
-
40
-
41
-
42
-
43
-
44
-
45
-
46
-
47
-
48
-
49
-
50
-
51
-
52
-
53
-
54
-
55
-
56
-
57
-
58
-
59
-
60
-
61
-
62
-
63
-
64
-
65
-
66
-
67
-
68
-
69
-
70
-
71
-
72
-
73
-
74
-
75
-
76
-
77
-
78
-
79
-
80
-
81
-
82
-
83
-
84
-
85
-
86
-
87
 |
 |

PART II
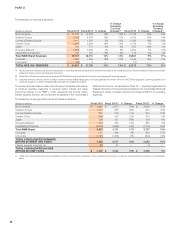
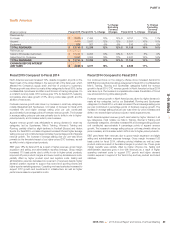
North America
(Dollars in millions) Fiscal 2015 Fiscal 2014 % Change
% Change
Excluding
Currency
Changes Fiscal 2013 % Change
% Change
Excluding
Currency
Changes
Revenues by:
Footwear $ 8,506 $ 7,495 13% 14% $ 6,751 11% 11%
Apparel 4,410 3,937 12% 12% 3,591 10% 10%
Equipment 824 867 -5% -5% 816 6% 6%
TOTAL REVENUES $ 13,740 $ 12,299 12% 12% $ 11,158 10% 10%
Revenues by:
Sales to Wholesale Customers $ 10,243 $ 9,296 10% 10% $ 8,571 8% 9%
Sales Direct to Consumer 3,497 3,003 16% 17% 2,587 16% 16%
TOTAL REVENUES $ 13,740 $ 12,299 12% 12% $ 11,158 10% 10%
EARNINGS BEFORE INTEREST
AND TAXES $ 3,645 $ 3,077 18% $ 2,639 17%
Fiscal 2015 Compared to Fiscal 2014
North America revenues increased 12%, despite congestion at ports on the
West Coast of the United States in the second half of the fiscal year, which
affected the Company’s supply chain and flow of product to customers.
Revenue growth was driven by nearly all key categories for fiscal 2015, led by
our Basketball, Sportswear and Men’s and Women’s Training categories. On
a constant currency basis, DTC revenue grew 17% for fiscal 2015, fueled by
comparable store sales growth of 8%, strong online sales growth and the
addition of new stores.
Footwear revenue growth was driven by increases in most key categories,
notably Basketball and Sportswear. Unit sales of footwear for fiscal 2015
increased 6% and higher average selling price per pair contributed
approximately 8 percentage points of footwear revenue growth. The increase
in average selling price per pair was primarily due to shifts in mix to higher-
priced products, and to a lesser extent, price increases.
Apparel revenue growth was attributable to strong demand in most key
categories, led by Sportswear, Men’s Training, Women’s Training and
Running, partially offset by slight declines in Football (Soccer) and Action
Sports. For fiscal 2015, unit sales of apparel increased 9% and higher average
selling price per unit contributed approximately 3 percentage points of apparel
revenue growth. The increase in average selling price per unit was driven
primarily by the favorable impact of our higher-priced DTC business, as well
as shifts in mix to higher-priced products.
EBIT grew 18% for fiscal 2015 as a result of higher revenues, gross margin
expansion and selling and administrative expense leverage. Gross margin
increased 110 basis points due to shifts in mix to higher-priced products,
improved off-price product margins and lower inventory obsolescence costs,
partially offset by higher product input and logistics costs. Selling and
administrative expense decreased as a percent of revenues despite higher
demand creation expense to support key brand and sporting events and
higher sports marketing expense. Operating overhead costs also increased to
support DTC growth and investments in infrastructure, as well as higher
performance-based compensation costs.
Fiscal 2014 Compared to Fiscal 2013
Our continued focus on the category offense drove increased demand for
NIKE Brand products across all key categories for fiscal 2014. Our Basketball,
Men’s Training, Running and Sportswear categories fueled the revenue
growth in fiscal 2014. DTC revenue growth in North America for fiscal 2014
was driven by a 7% increase in comparable store sales, the addition of 16 net
new stores and strong online sales growth.
Footwear revenue growth in North America was driven by higher demand in
nearly all key categories, led by our Basketball, Running and Sportswear
categories. For fiscal 2014, unit sales increased 7% and average selling price
per pair contributed 4 percentage points of footwear revenue growth. The
increase in average selling price per pair was driven by price increases and
shifts in mix toward higher-priced products in nearly equal amounts.
North America apparel revenue growth was fueled by higher demand in all
key categories, most notably our Men’s Training, Women’s Training and
Sportswear categories. Unit sales increased 6% and average selling price per
unit contributed approximately 4 percentage points of apparel revenue
growth. The increase in average selling price per unit was primarily driven by
price increases, and to a lesser extent, shifts in mix to higher-priced products.
EBIT grew faster than revenues due to gross margin expansion and slight
selling and administrative expense leverage. Gross margin increased 120
basis points for fiscal 2014, reflecting pricing initiatives as well as lower
product costs as a result of favorable changes in product mix. These gross
margin benefits were partially offset by higher off-price mix. Selling and
administrative expenses grew in line with revenues as a result of higher
operating overhead costs to support DTC growth and higher demand
creation expense in support of the World Cup and key product and brand
initiatives.
NIKE, INC. 2015 Annual Report and Notice of Annual Meeting 89
FORM 10-K