Nike 2015 Annual Report Download - page 61
Download and view the complete annual report
Please find page 61 of the 2015 Nike annual report below. You can navigate through the pages in the report by either clicking on the pages listed below, or by using the keyword search tool below to find specific information within the annual report.-
 1
1 -
2
-
3
-
4
-
5
-
6
-
7
-
8
-
9
-
10
-
11
-
12
-
13
-
14
-
15
-
16
-
17
-
18
-
19
-
20
-
21
-
22
-
23
-
24
-
25
-
26
-
27
-
28
-
29
-
30
-
31
-
32
-
33
-
34
-
35
-
36
-
37
-
38
-
39
-
40
-
41
-
42
-
43
-
44
-
45
-
46
-
47
-
48
-
49
-
50
-
 51
51 -
 52
52 -
 53
53 -
 54
54 -
 55
55 -
 56
56 -
 57
57 -
 58
58 -
 59
59 -
 60
60 -
 61
61 -
 62
62 -
 63
63 -
 64
64 -
 65
65 -
 66
66 -
 67
67 -
 68
68 -
 69
69 -
 70
70 -
 71
71 -
72
-
73
-
74
-
75
-
76
-
77
-
78
-
79
-
80
-
81
-
82
-
83
-
84
-
85
-
86
-
87
 |
 |

PART II
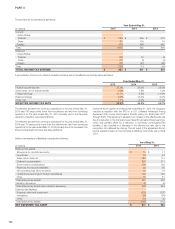
The provision for income taxes is as follows:
Year Ended May 31,
(In millions) 2015 2014 2013
Current:
United States
Federal $ 596 $ 259 $ 378
State 80 104 79
Foreign 369 499 442
Total 1,045 862 899
Deferred:
United States
Federal (66) 19 (4)
State (11) (3) (4)
Foreign (36) (27) (86)
Total (113) (11) (94)
TOTAL INCOME TAX EXPENSE $ 932 $ 851 $ 805
A reconciliation from the U.S. statutory federal income tax rate to the effective income tax rate is as follows:
Year Ended May 31,
2015 2014 2013
Federal income tax rate 35.0% 35.0% 35.0%
State taxes, net of federal benefit 0.9% 1.8% 1.4%
Foreign earnings -15.7% 2.2% -11.8%
Deferred charge 0.9% -14.6% 0.0%
Other, net 1.1% -0.4% 0.1%
EFFECTIVE INCOME TAX RATE 22.2% 24.0% 24.7%
The effective tax rate from continuing operations for the year ended May 31,
2015 was 180 basis points lower than the effective tax rate from continuing
operations for the year ended May 31, 2014 primarily due to the favorable
resolution of audits in several jurisdictions.
The effective tax rate from continuing operations for the year ended May 31,
2014 was 70 basis points lower than the effective tax rate from continuing
operations for the year ended May 31, 2013 primarily due to an increase in the
amount of earnings from lower tax rate jurisdictions.
During the fourth quarter of the fiscal year ended May 31, 2014, the Company
reached a resolution with the IRS on a U.S. Unilateral Advanced Pricing
Agreement that covers intercompany transfer pricing for fiscal years 2011
through 2020. This agreement resulted in an increase in the effective tax rate
due to a reduction in the Company’s permanently reinvested foreign earnings,
which was partially offset by a reduction in previously unrecognized tax
benefits. It also resulted in a decrease in the effective tax rate due to the
recognition of a deferred tax charge. The net result of the agreement did not
have a material impact on the Company’s effective income tax rate in fiscal
2014.
Deferred tax assets and (liabilities) comprise the following:
As of May 31,
(In millions) 2015 2014
Deferred tax assets:
Allowance for doubtful accounts $11$ 11
Inventories 59 49
Sales return reserves 143 113
Deferred compensation 258 211
Stock-based compensation 179 162
Reserves and accrued liabilities 92 95
Net operating loss carry-forwards 10 16
Undistributed earnings of foreign subsidiaries 149 194
Other 76 51
Total deferred tax assets 977 902
Valuation allowance (9) (9)
Total deferred tax assets after valuation allowance 968 893
Deferred tax liabilities:
Property, plant and equipment (220) (237)
Intangibles (93) (94)
Other (38) (2)
Total deferred tax liability (351) (333)
NET DEFERRED TAX ASSET $ 617 $ 560
122