Nike 2015 Annual Report Download - page 34
Download and view the complete annual report
Please find page 34 of the 2015 Nike annual report below. You can navigate through the pages in the report by either clicking on the pages listed below, or by using the keyword search tool below to find specific information within the annual report.-
 1
1 -
2
-
3
-
4
-
5
-
6
-
7
-
8
-
9
-
10
-
11
-
12
-
13
-
14
-
15
-
16
-
17
-
18
-
19
-
20
-
21
-
22
-
23
-
 24
24 -
 25
25 -
 26
26 -
 27
27 -
 28
28 -
 29
29 -
 30
30 -
 31
31 -
 32
32 -
 33
33 -
 34
34 -
 35
35 -
 36
36 -
 37
37 -
 38
38 -
 39
39 -
 40
40 -
 41
41 -
 42
42 -
 43
43 -
 44
44 -
45
-
46
-
47
-
48
-
49
-
50
-
51
-
52
-
53
-
54
-
55
-
56
-
57
-
58
-
59
-
60
-
61
-
62
-
63
-
64
-
65
-
66
-
67
-
68
-
69
-
70
-
71
-
72
-
73
-
74
-
75
-
76
-
77
-
78
-
79
-
80
-
81
-
82
-
83
-
84
-
85
-
86
-
87
 |
 |

PART II
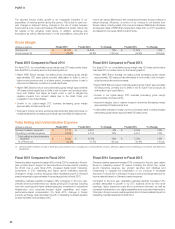
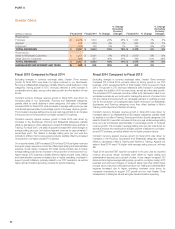
Fiscal 2015 Compared to Fiscal 2014
Excluding changes in currency exchange rates, revenues for Converse
increased 21% for fiscal 2015. Comparable direct distribution markets (i.e.,
markets served under a direct distribution model for comparable periods in
the current and prior fiscal years) grew 14%, contributing 12 percentage
points of total revenue growth for fiscal 2015. Comparable direct distribution
market unit sales increased 12% and average selling price per unit
contributed approximately 2 percentage points of Converse comparable
direct distribution market revenue growth. The United States market was the
most significant contributor to the growth of comparable direct distribution
markets due to volume increases with key wholesale customers and
expansion of our DTC business. Conversion of markets from licensed to
direct distribution contributed 8 percentage points of total Converse revenue
growth for fiscal 2015, driven by conversion of several European markets,
most significantly AGS (Austria, Germany and Switzerland). Revenues from
comparable licensed markets increased 8% for fiscal 2015, contributing 1
percentage point of total Converse revenue growth.
EBIT for Converse increased 4% for fiscal 2015 as strong revenue growth
was partially offset by lower gross margin and higher selling and administrative
expense. Gross margin decreased 60 basis points primarily due to transitions
of licensed markets to direct distribution markets. Selling and administrative
expense increased for fiscal 2015, primarily due to higher operating overhead
costs resulting from investments in infrastructure to support current and future
growth, including market transitions, new systems and new headquarters, as
well as higher intellectual property enforcement costs.
Fiscal 2014 Compared to Fiscal 2013
Excluding changes in currency exchange rates, revenues for Converse
increased 15% for fiscal 2014. Comparable direct distribution markets grew
13%, contributing 10 percentage points of total revenue growth for fiscal
2014, primarily due to strength in our United States, China and United
Kingdom markets. Comparable direct distribution market unit sales increased
12% and average selling price per unit contributed approximately 1
percentage point of Converse comparable direct distribution market revenue
growth. Conversion of markets from licensed to direct distribution contributed
4 percentage points of total Converse revenue growth for fiscal 2014.
Revenues from comparable licensed markets increased 8% for fiscal 2014,
contributing 1 percentage point of total Converse revenue growth.
On a reported basis, EBIT at Converse grew 17% for fiscal 2014 as higher
revenues and gross margin were partially offset by higher selling and
administrative expense. Gross margin increased 80 basis points, primarily
due to growth in higher-margin territories and products within our direct
distribution markets. Selling and administrative expense grew faster than
revenue for fiscal 2014 due to higher operating overhead to support growth
initiatives and DTC expansion, as well as higher demand creation spending.
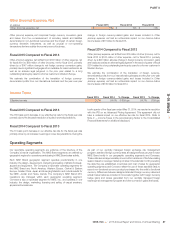
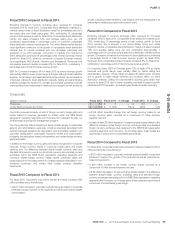
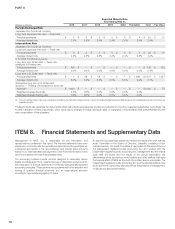
Corporate
(Dollars in millions) Fiscal 2015 Fiscal 2014 % Change Fiscal 2013 % Change
Revenues $ (82) $ 3 — $ (17) —
(Loss) Before Interest and Taxes $ (1,101) $ (1,036) 6% $ (909) 14%
Corporate revenues primarily consist of foreign currency hedge gains and
losses related to revenues generated by entities within the NIKE Brand
geographic operating segments and Converse but managed through our
central foreign exchange risk management program.
The Corporate loss before interest and taxes consists largely of unallocated
general and administrative expenses, including expenses associated with
centrally managed departments; depreciation and amortization related to our
corporate headquarters; unallocated insurance, benefit and compensation
programs, including stock-based compensation; and certain foreign currency
gains and losses.
In addition to the foreign currency gains and losses recognized in Corporate
revenues, foreign currency results in Corporate include gains and losses
resulting from the difference between actual foreign currency rates and
standard rates used to record non-functional currency denominated product
purchases within the NIKE Brand geographic operating segments and
Converse; related foreign currency hedge results; conversion gains and
losses arising from re-measurement of monetary assets and liabilities in non-
functional currencies; and certain other foreign currency derivative
instruments.
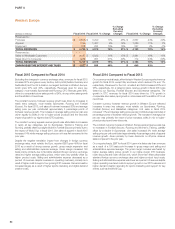
Fiscal 2015 Compared to Fiscal 2014
For fiscal 2015, Corporate’s loss before interest and taxes increased $65
million primarily due to the following:
•a $211 million increase in corporate overhead expense related to corporate
initiatives to support growth of the business as well as performance-based
compensation;
•a $144 million beneficial change from net foreign currency losses to net
foreign currency gains, reported as a component of Other (income)
expense, net;and
•an approximate $2 million increase in foreign exchange losses related to the
difference between actual foreign currency exchange rates and standard
foreign currency exchange rates assigned to the NIKE Brand geographic
operating segments and Converse, net of hedge gains; these losses are
reported as a component of consolidated gross margin.
Fiscal 2014 Compared to Fiscal 2013
For fiscal 2014, Corporate’s loss before interest and taxes increased by $127
million primarily due to the following:
•a $101 million increase in corporate overhead expense related to corporate
initiatives to support the growth of the business as well as performance-
based compensation;
•a $90 million increase in net foreign currency losses, reported as a
component of Other (income) expense, net;and
•a $ 56 million decrease in foreign exchange losses related to the difference
between actual foreign currency exchange rates and standard foreign
currency exchange rates assigned to the NIKE Brand geographic operating
segments and Converse, net of hedge gains; these losses are reported as a
component of consolidated gross margin.
NIKE, INC. 2015 Annual Report and Notice of Annual Meeting 95
FORM 10-K