Nike 2015 Annual Report Download - page 26
Download and view the complete annual report
Please find page 26 of the 2015 Nike annual report below. You can navigate through the pages in the report by either clicking on the pages listed below, or by using the keyword search tool below to find specific information within the annual report.-
 1
1 -
2
-
3
-
4
-
5
-
6
-
7
-
8
-
9
-
10
-
11
-
12
-
13
-
14
-
15
-
 16
16 -
 17
17 -
 18
18 -
 19
19 -
 20
20 -
 21
21 -
 22
22 -
 23
23 -
 24
24 -
 25
25 -
 26
26 -
 27
27 -
 28
28 -
 29
29 -
 30
30 -
 31
31 -
 32
32 -
 33
33 -
 34
34 -
 35
35 -
 36
36 -
37
-
38
-
39
-
40
-
41
-
42
-
43
-
44
-
45
-
46
-
47
-
48
-
49
-
50
-
51
-
52
-
53
-
54
-
55
-
56
-
57
-
58
-
59
-
60
-
61
-
62
-
63
-
64
-
65
-
66
-
67
-
68
-
69
-
70
-
71
-
72
-
73
-
74
-
75
-
76
-
77
-
78
-
79
-
80
-
81
-
82
-
83
-
84
-
85
-
86
-
87
 |
 |

PART II
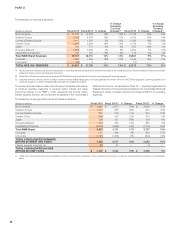
Other (Income) Expense, Net
(In millions) Fiscal 2015 Fiscal 2014 Fiscal 2013
Other (income) expense, net $ (58) $ 103 $ (15)
Other (income) expense, net comprises foreign currency conversion gains
and losses from the re-measurement of monetary assets and liabilities
denominated in non-functional currencies and the impact of certain foreign
currency derivative instruments, as well as unusual or non-operating
transactions that are outside the normal course of business.
Fiscal 2015 Compared to Fiscal 2014
Other (income) expense, net shifted from $103 million of other expense, net
for fiscal 2014 to $58 million of other (income), net for fiscal 2015, primarily
driven by a $147 million change to net foreign currency conversion gains,
primarily due to significant hedge gains from available-for-sale investments, as
well as an adverse legal judgment in the prior year related to a long
outstanding bankruptcy case for a former customer in Western Europe.
We estimate the combination of the translation of foreign currency-
denominated profits from our international business and the year-over-year
change in foreign currency-related gains and losses included in Other
(income) expense, net had an unfavorable impact on our Income before
income taxes of $73 million for fiscal 2015.
Fiscal 2014 Compared to Fiscal 2013
Other (income) expense, net shifted from $15 million of other (income), net for
fiscal 2013 to $103 million of other expense, net for fiscal 2014, primarily
driven by a $90 million adverse change in foreign currency conversion gains
and losses as well as an adverse legal judgment in the second quarter of fiscal
2014 related to a long outstanding bankruptcy case for a former customer in
Western Europe.
We estimate the combination of the translation of foreign currency-
denominated profits from our international businesses and the year-over-year
change in foreign currency-related gains and losses included in Other
(income) expense, net had an unfavorable impact on our Income before
income taxes of $139 million for fiscal 2014.
Income Taxes
Fiscal 2015 Fiscal 2014 % Change Fiscal 2013 % Change
Effective tax rate 22.2% 24.0% (180) bps 24.7% (70) bps
Fiscal 2015 Compared to Fiscal 2014
The 180 basis point decrease in our effective tax rate for the fiscal year was
primarily due to the favorable resolution of audits in several jurisdictions.
Fiscal 2014 Compared to Fiscal 2013
The 70 basis point decrease in our effective tax rate for the fiscal year was
primarily driven by an increase in earnings in lower tax jurisdictions. During the
fourth quarter of the fiscal year ended May 31, 2014, we reached a resolution
with the IRS on an Advanced Pricing Agreement. This agreement did not
have a material impact on our effective tax rate for fiscal 2014. Refer to
Note 9 — Income Taxes in the accompanying Notes to the Consolidated
Financial Statements for additional disclosure.
Operating Segments
Our reportable operating segments are evidence of the structure of the
Company’s internal organization. The NIKE Brand segments are defined by
geographic regions for operations participating in NIKE Brand sales activity.
Each NIKE Brand geographic segment operates predominantly in one
industry: the design, development, marketing and selling of athletic footwear,
apparel and equipment. The Company’s reportable operating segments for
the NIKE Brand are: North America, Western Europe, Central & Eastern
Europe, Greater China, Japan and Emerging Markets, and include results for
the NIKE, Jordan and Hurley brands. The Company’s NIKE Brand DTC
operations are managed within each geographic operating segment.
Converse is also a reportable segment for NIKE, Inc., and operates in one
industry: the design, marketing, licensing and selling of casual sneakers,
apparel and accessories.
As part of our centrally managed foreign exchange risk management
program, standard foreign currency rates are assigned twice per year to each
NIKE Brand entity in our geographic operating segments and Converse.
These rates are set approximately nine months in advance of the future selling
season based on average market spot rates in the calendar month preceding
the date they are established. Inventories and cost of sales for geographic
operating segments and Converse reflect the use of these standard rates to
record non-functional currency product purchases into the entity’s functional
currency. Differences between assigned standard foreign currency rates and
actual market rates are included in Corporate together with foreign currency
hedge gains and losses generated from our centrally managed foreign
exchange risk management program and other conversion gains and losses.
NIKE, INC. 2015 Annual Report and Notice of Annual Meeting 87
FORM 10-K