Nike 2015 Annual Report Download - page 58
Download and view the complete annual report
Please find page 58 of the 2015 Nike annual report below. You can navigate through the pages in the report by either clicking on the pages listed below, or by using the keyword search tool below to find specific information within the annual report.-
 1
1 -
2
-
3
-
4
-
5
-
6
-
7
-
8
-
9
-
10
-
11
-
12
-
13
-
14
-
15
-
16
-
17
-
18
-
19
-
20
-
21
-
22
-
23
-
24
-
25
-
26
-
27
-
28
-
29
-
30
-
31
-
32
-
33
-
34
-
35
-
36
-
37
-
38
-
39
-
40
-
41
-
42
-
43
-
44
-
45
-
46
-
47
-
 48
48 -
 49
49 -
 50
50 -
 51
51 -
 52
52 -
 53
53 -
 54
54 -
 55
55 -
 56
56 -
 57
57 -
 58
58 -
 59
59 -
 60
60 -
 61
61 -
 62
62 -
 63
63 -
 64
64 -
 65
65 -
 66
66 -
 67
67 -
 68
68 -
69
-
70
-
71
-
72
-
73
-
74
-
75
-
76
-
77
-
78
-
79
-
80
-
81
-
82
-
83
-
84
-
85
-
86
-
87
 |
 |

PART II
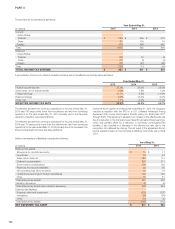
NOTE 6 — Fair Value Measurements
The following tables present information about the Company’s financial assets and liabilities measured at fair value on a recurring basis as of May 31, 2015 and
2014 and indicate the fair value hierarchy of the valuation techniques utilized by the Company to determine such fair value. Refer to Note 1 — Summary of
Significant Accounting Policies for additional detail regarding the Company’s fair value measurement methodology.
As of May 31, 2015
(In millions)
Assets at Fair
Value
Cash and Cash
Equivalents
Short-term
Investments
Other Long-term
Assets
Cash $ 615 $ 615 $ — $ —
Level 1:
U.S. Treasury securities 869 225 644 —
Level 2:
Time deposits 684 684 — —
U.S. Agency securities 976 110 866 —
Commercial paper and bonds 914 352 562 —
Money market funds 1,866 1,866 — —
Total level 2 4,440 3,012 1,428 —
Level 3:
Non-marketable preferred stock 8 — — 8
TOTAL $ 5,932 $ 3,852 $ 2,072 $ 8
As of May 31, 2014
(In millions)
Assets at Fair
Value
Cash and Cash
Equivalents
Short-term
Investments
Other Long-term
Assets
Cash $ 780 $ 780 $ — $ —
Level 1:
U.S. Treasury securities 1,137 151 986 —
Level 2:
Time deposits 227 227 — —
U.S. Agency securities 1,027 25 1,002 —
Commercial paper and bonds 959 25 934 —
Money market funds 1,012 1,012 — —
Total level 2 3,225 1,289 1,936 —
Level 3:
Non-marketable preferred stock 7 — — 7
TOTAL $ 5,149 $ 2,220 $ 2,922 $ 7
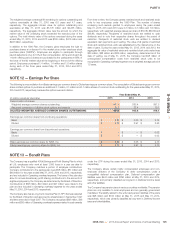
The Company elects to record the gross assets and liabilities of its derivative
financial instruments on the Consolidated Balance Sheets. The Company’s
derivative financial instruments are subject to master netting arrangements
that allow for the offset of assets and liabilities in the event of default or early
termination of the contract. Any amounts of cash collateral received related to
these instruments associated with the Company’s credit-related contingent
features are recorded in Cash and equivalents and Accrued liabilities,the
latter of which would further offset against the Company’s derivative asset
balance (refer to Note 17 — Risk Management and Derivatives). Cash
collateral received related to the Company’s credit related contingent features
is presented in the Cash provided by operations component of the
Consolidated Statement of Cash Flows. Any amounts of non-cash collateral
received, such as securities, are not recorded on the Consolidated Balance
Sheets pursuant to the accounting standards for non-cash collateral received.
The following tables present information about the Company’s derivative assets and liabilities measured at fair value on a recurring basis as of May 31, 2015 and
May 31, 2014, and indicate the level in the fair value hierarchy in which the Company classifies the fair value measurement.
As of May 31, 2015
Derivative Assets Derivative Liabilities
(In millions)
Assets
at Fair
Value
Other
Current
Assets
Other
Long-
term
Assets
Liabilities
at Fair
Value
Accrued
Liabilities
Other
Long-
term
Liabilities
Level 2:
Foreign exchange forwards and options(1) $ 1,554 $ 1,034 $ 520 $ 164 $ 160 $ 4
Embedded derivatives 7 2 5 11 2 9
Interest rate swaps(2) 78 78 — — — —
TOTAL $ 1,639 $ 1,114 $ 525 $ 175 $ 162 $ 13
(1) If the foreign exchange derivative instruments had been netted in the Consolidated Balance Sheets, the asset and liability positions each would have been reduced by $161 million as of
May 31, 2015. As of that date, the Company had received $900 million of cash collateral and $74 million of securities from various counterparties related to these foreign exchange
derivative instruments. No amount of collateral was posted on the Company’s derivative liability balance as of May 31, 2015.
(2) As of May 31, 2015, the Company had received $68 million of cash collateral related to its interest rate swaps.
NIKE, INC. 2015 Annual Report and Notice of Annual Meeting 119
FORM 10-K