Nike 2015 Annual Report Download - page 33
Download and view the complete annual report
Please find page 33 of the 2015 Nike annual report below. You can navigate through the pages in the report by either clicking on the pages listed below, or by using the keyword search tool below to find specific information within the annual report.-
 1
1 -
2
-
3
-
4
-
5
-
6
-
7
-
8
-
9
-
10
-
11
-
12
-
13
-
14
-
15
-
16
-
17
-
18
-
19
-
20
-
21
-
22
-
 23
23 -
 24
24 -
 25
25 -
 26
26 -
 27
27 -
 28
28 -
 29
29 -
 30
30 -
 31
31 -
 32
32 -
 33
33 -
 34
34 -
 35
35 -
 36
36 -
 37
37 -
 38
38 -
 39
39 -
 40
40 -
 41
41 -
 42
42 -
 43
43 -
44
-
45
-
46
-
47
-
48
-
49
-
50
-
51
-
52
-
53
-
54
-
55
-
56
-
57
-
58
-
59
-
60
-
61
-
62
-
63
-
64
-
65
-
66
-
67
-
68
-
69
-
70
-
71
-
72
-
73
-
74
-
75
-
76
-
77
-
78
-
79
-
80
-
81
-
82
-
83
-
84
-
85
-
86
-
87
 |
 |

PART II
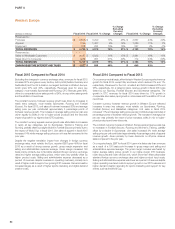
Constant currency apparel revenue growth was due to increases in nearly all
key categories, primarily Sportswear, Running and Women’s Training,
partially offset by a decline in Football (Soccer) revenues due to higher World
Cup sales in fiscal 2014. Unit sales of apparel decreased 1% while average
selling price per unit contributed approximately 6 percentage points of apparel
revenue growth. The increase in average selling price per unit was primarily
attributable to an increase in revenues from our higher-priced DTC business,
and to a lesser extent, price increases in response to inflationary conditions.
On a reported basis, EBIT decreased 14% primarily due to reported revenue
declines, lower gross margin and higher selling and administrative expense,
as well as the impact of weakening foreign currency exchange rates. Gross
margin decreased 140 basis points due to unfavorable standard foreign
currency exchange rates, higher inventory obsolescence and higher off-price
mix, partially offset by higher average selling prices. Selling and administrative
expense increased due to higher operating overhead costs, primarily to
support DTC growth, as well as higher demand creation expense, in part as a
result of support for the World Cup in early fiscal 2015 and higher sports
marketing expense.
Fiscal 2014 Compared to Fiscal 2013
Excluding changes in currency exchange rates, fiscal 2014 revenues for
Emerging Markets increased 13% as a result of growth across nearly every
territory. Our largest territory, Brazil, grew 19%, while our SOCO territory grew
25%. Mexico revenues decreased 3% largely as a result of shipping delays
caused by issues with a distribution center transition in the first half of fiscal
2014. On a category basis, revenues were higher in nearly every category, led
by Football (Soccer), Running and Sportswear.
Constant currency footwear revenue growth for fiscal 2014 was driven by
growth in nearly every key category, led by Running, Sportswear, Football
(Soccer) and Action Sports. Unit sales for fiscal 2014 increased 4% and
average selling price per pair contributed approximately 6 percentage points
of footwear revenue growth. The increase in average selling price per pair was
primarily driven by price increases, in part reflecting inflationary conditions in
certain Latin American territories, and to a lesser extent, shifts in mix to higher-
priced products.
Constant currency apparel revenue increased driven by growth in every key
category, most notably Football (Soccer) and Running. Unit sales increased
11% and average selling price per unit contributed approximately 10
percentage points of apparel revenue growth, primarily due to price
increases, in part reflecting inflationary conditions in certain Latin American
territories.
Fiscal 2014 reported EBIT decreased primarily due to a decline in gross
margin, higher selling and administrative expense and weaker currencies in a
number of developing markets. Gross margin decreased 30 basis points due
primarily to unfavorable foreign currency exchange rates, higher product
costs, higher warehousing costs related to distribution center transition
challenges in Mexico and higher discounts, which more than offset higher
average selling prices. Selling and administrative expense increased due to
higher operating overhead costs to support the expansion of our DTC
business and infrastructure investments to support growth, as well as
increases in demand creation spending to support the World Cup and key
product launches.
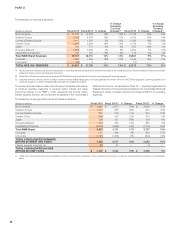
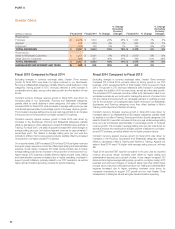
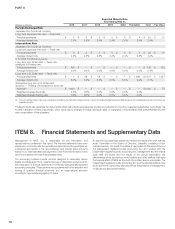
Global Brand Divisions
(Dollars in millions) Fiscal 2015 Fiscal 2014 % Change
% Change
Excluding
Currency
Changes Fiscal 2013 % Change
% Change
Excluding
Currency
Changes
Revenues $ 115 $ 125 -8% -2% $ 115 9% 6%
(Loss) Before Interest and Taxes $ (2,263) $ (1,993) 14% $ (1,716) 16%
Global Brand Divisions primarily represent demand creation, operating
overhead and product creation and design expenses that are centrally
managed for the NIKE Brand. Revenues for Global Brand Divisions are
primarily attributable to NIKE Brand licensing businesses that are not part of a
geographic operating segment.
Fiscal 2015 Compared to Fiscal 2014
Global Brand Divisions’ loss before interest and taxes increased $270 million
in fiscal 2015, primarily due to higher operating overhead reflecting continued
investments in operational infrastructure, including digital capabilities,
consumer engagement and supply chain initiatives, as well as higher
performance-based compensation. Demand creation expense increased
slightly due to support for the World Cup in the first quarter of fiscal 2015 and
key brand and consumer events.
Fiscal 2014 Compared to Fiscal 2013
For fiscal 2014, Global Brand Divisions’ loss before interest and taxes
increased $277 million, primarily driven by an increase in centrally managed
product costs, increased investments in our digital infrastructure, as well as
higher demand creation spending in the fourth quarter of fiscal 2014 to
support the World Cup and product creation and design initiatives.
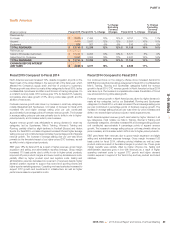
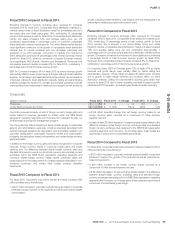
Converse
(Dollars in millions) Fiscal 2015 Fiscal 2014 % Change
% Change
Excluding
Currency
Changes Fiscal 2013 % Change
% Change
Excluding
Currency
Changes
Revenues $ 1,982 $ 1,684 18% 21%$ 1,449 16% 15%
Earnings Before Interest and Taxes $ 517 $ 496 4% $ 425 17%
In territories we define as “direct distribution markets” Converse designs,
markets and sells products directly to distributors, wholesale customers and
to consumers through DTC operations. The largest direct distribution markets
are the United States, the United Kingdom and China. Converse does not
own the Converse trademarks in Japan. Territories other than direct
distribution markets and Japan are serviced by third-party licensees who pay
royalties to Converse for the use of its registered trademarks and other
intellectual property rights.
94