Nike 2015 Annual Report Download - page 32
Download and view the complete annual report
Please find page 32 of the 2015 Nike annual report below. You can navigate through the pages in the report by either clicking on the pages listed below, or by using the keyword search tool below to find specific information within the annual report.-
 1
1 -
2
-
3
-
4
-
5
-
6
-
7
-
8
-
9
-
10
-
11
-
12
-
13
-
14
-
15
-
16
-
17
-
18
-
19
-
20
-
21
-
 22
22 -
 23
23 -
 24
24 -
 25
25 -
 26
26 -
 27
27 -
 28
28 -
 29
29 -
 30
30 -
 31
31 -
 32
32 -
 33
33 -
 34
34 -
 35
35 -
 36
36 -
 37
37 -
 38
38 -
 39
39 -
 40
40 -
 41
41 -
 42
42 -
43
-
44
-
45
-
46
-
47
-
48
-
49
-
50
-
51
-
52
-
53
-
54
-
55
-
56
-
57
-
58
-
59
-
60
-
61
-
62
-
63
-
64
-
65
-
66
-
67
-
68
-
69
-
70
-
71
-
72
-
73
-
74
-
75
-
76
-
77
-
78
-
79
-
80
-
81
-
82
-
83
-
84
-
85
-
86
-
87
 |
 |

PART II
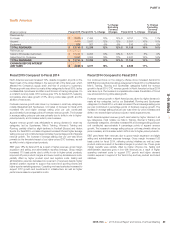
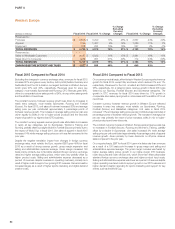
Japan
(Dollars in millions) Fiscal 2015 Fiscal 2014 % Change
% Change
Excluding
Currency
Changes Fiscal 2013 % Change
% Change
Excluding
Currency
Changes
Revenues by:
Footwear $ 452 $ 409 11% 23% $ 439 -7% 11%
Apparel 230 276 -17% -8% 337 -18% -2%
Equipment 73 86 -15% -6% 100 -14% 2%
TOTAL REVENUES $ 755 $ 771 -2% 9% $ 876 -12% 5%
Revenues by:
Sales to Wholesale Customers $ 536 $ 597 -10% 0% $ 700 -15% 1%
Sales Direct to Consumer 219 174 26% 40% 176 -1% 18%
TOTAL REVENUES $ 755 $ 771 -2% 9% $ 876 -12% 5%
EARNINGS BEFORE INTEREST AND TAXES $ 100 $ 131 -24% $ 139 -6%
Fiscal 2015 Compared to Fiscal 2014
Constant currency revenues for Japan increased 9% in fiscal 2015, driven
primarily by increases in Sportswear, Basketball and Running, partially offset
by declines in Men’s Training, Golf and Women’s Training. DTC revenues
grew 40% in fiscal 2015 driven by a 20% increase in comparable store sales,
strong online sales growth and the addition of new stores.
On a reported basis, fiscal 2015 EBIT decreased 24% compared to the prior
year period, reflecting the impact of the weaker Yen. Gross margin decreased
270 basis points as unfavorable standard foreign currency exchange rates
and higher product costs more than offset higher average selling prices and
an increase in the proportion of revenues from our higher-margin DTC
business. Selling and administrative expense increased as a percent of
revenues as higher operating overhead, primarily to support our expanding
DTC business, was only partially offset by a decrease in demand creation
expense.
Fiscal 2014 Compared to Fiscal 2013
On a currency-neutral basis, revenues increased 5% for Japan, driven by
higher revenues in Sportswear, Football (Soccer) and Basketball, partially
offset by lower revenues in Men’s Training and Golf.
Fiscal 2014 EBIT decreased 6% as a 12% decline in reported revenues, due
to the weaker Yen, was only partially offset by higher gross margin and selling
and administrative expense leverage. Gross margin increased 20 basis points
as higher average selling prices, favorable off-price mix and the favorable
impact of higher-margin DTC revenues were mostly offset by unfavorable
standard foreign currency exchange rates. The decrease in selling and
administrative expense in fiscal 2014 was attributable to lower operating
overhead and demand creation spending.
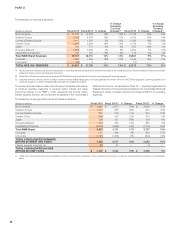
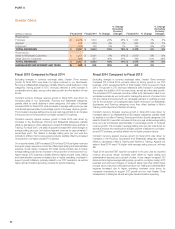
Emerging Markets
(Dollars in millions) Fiscal 2015 Fiscal 2014 % Change
% Change
Excluding
Currency
Changes Fiscal 2013 % Change
% Change
Excluding
Currency
Changes
Revenues by:
Footwear $ 2,641 $ 2,642 0% 9% $ 2,621 1% 10%
Apparel 1,021 1,061 -4% 5% 962 10% 21%
Equipment 236 246 -4% 5% 249 -1% 9%
TOTAL REVENUES $ 3,898 $ 3,949 -1% 8% $ 3,832 3% 13%
Revenues by:
Sales to Wholesale Customers $ 3,247 $ 3,483 -7% 2% $ 3,443 1% 11%
Sales Direct to Consumer 651 466 40% 51% 389 20% 28%
TOTAL REVENUES $ 3,898 $ 3,949 -1% 8% $ 3,832 3% 13%
EARNINGS BEFORE INTEREST AND TAXES $ 818 $ 952 -14% $ 985 -3%
Fiscal 2015 Compared to Fiscal 2014
On a currency-neutral basis, fiscal 2015 revenues for Emerging Markets
increased 8%, driven by growth in 7 of 9 territories. Growth was led by one of
our largest territories, SOCO (which includes Argentina, Uruguay and Chile),
which grew 28%, and our Pacific territory (which includes Australia and New
Zealand), which grew 26%. Revenues in our Mexico and Brazil territories
decreased 21% and 3%, respectively. The decrease in Mexico was
attributable to efforts to liquidate excess inventory in the marketplace largely
resulting from an inconsistent flow of product to customers following
distribution center transition issues in fiscal 2014, while the decrease in Brazil
was primarily due to challenging macroeconomic conditions and comparison
to strong sales related to the World Cup in fiscal 2014. On a category basis,
revenues were higher in most key categories, led by Sportswear, Running
and Basketball, partially offset by a decline in Football (Soccer). DTC revenues
increased 51% compared to fiscal 2014, driven by strong comparable store
sales growth of 26%, the addition of new stores and online sales growth.
The constant currency growth in footwear revenue for fiscal 2015 was
attributable to increases in several key categories, most notably Sportswear,
Basketball, Action Sports and Running. Unit sales of footwear decreased 2%
while average selling price per pair contributed approximately 11 percentage
points of footwear revenue growth. The increase in average selling price per
pair was primarily due to price increases in response to inflationary conditions
in certain Latin American countries, particularly Argentina, as well as shifts in
mix to higher-priced products and the favorable impact of growth in our
higher-priced DTC business.
NIKE, INC. 2015 Annual Report and Notice of Annual Meeting 93
FORM 10-K