Nike 2015 Annual Report Download - page 36
Download and view the complete annual report
Please find page 36 of the 2015 Nike annual report below. You can navigate through the pages in the report by either clicking on the pages listed below, or by using the keyword search tool below to find specific information within the annual report.-
 1
1 -
2
-
3
-
4
-
5
-
6
-
7
-
8
-
9
-
10
-
11
-
12
-
13
-
14
-
15
-
16
-
17
-
18
-
19
-
20
-
21
-
22
-
23
-
24
-
25
-
 26
26 -
 27
27 -
 28
28 -
 29
29 -
 30
30 -
 31
31 -
 32
32 -
 33
33 -
 34
34 -
 35
35 -
 36
36 -
 37
37 -
 38
38 -
 39
39 -
 40
40 -
 41
41 -
 42
42 -
 43
43 -
 44
44 -
 45
45 -
 46
46 -
47
-
48
-
49
-
50
-
51
-
52
-
53
-
54
-
55
-
56
-
57
-
58
-
59
-
60
-
61
-
62
-
63
-
64
-
65
-
66
-
67
-
68
-
69
-
70
-
71
-
72
-
73
-
74
-
75
-
76
-
77
-
78
-
79
-
80
-
81
-
82
-
83
-
84
-
85
-
86
-
87
 |
 |

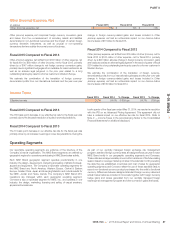
PART II
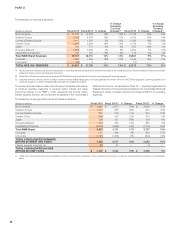
Refer to Note 6 — Fair Value Measurements and Note 17 — Risk
Management and Derivatives in the accompanying Notes to the Consolidated
Financial Statements for additional description of how the above financial
instruments are valued and recorded as well as the fair value of outstanding
derivatives at each reported period end.
Translational Exposures
Many of our foreign subsidiaries operate in functional currencies other than
the U.S. Dollar. Fluctuations in currency exchange rates create volatility in our
reported results as we are required to translate the balance sheets,
operational results and cash flows of these subsidiaries into U.S. Dollars for
consolidated reporting. The translation of foreign subsidiaries’ non-U.S. Dollar
denominated balance sheets into U.S. Dollars for consolidated reporting
results in a cumulative translation adjustment to Other comprehensive income
within the Consolidated Statements of Shareholders’ Equity. In the translation
of our Consolidated Statements of Income, a weaker U.S. Dollar in relation to
foreign functional currencies benefits our consolidated earnings whereas a
stronger U.S. Dollar reduces our consolidated earnings. The impact of foreign
exchange rate fluctuations on the translation of our consolidated Revenues
was a detriment of approximately $1,171 million and $288 million for the years
ended May 31, 2015 and 2014, respectively. The impact of foreign exchange
rate fluctuations on the translation of our Income before income taxes was a
detriment of approximately $221 million and $49 million for the years ended
May 31, 2015 and 2014, respectively.
Managing Translational Exposures
To minimize the impact of translating foreign currency denominated revenues
and expenses into U.S. Dollars for consolidated reporting, certain foreign
subsidiaries use excess cash to purchase U.S. Dollar denominated available-
for-sale investments. The variable future cash flows associated with the
purchase and subsequent sale of these U.S. Dollar denominated securities at
non-U.S. Dollar functional currency subsidiaries creates a foreign currency
exposure that qualifies for hedge accounting under the accounting standards
for derivatives and hedging. We utilize forward contracts and/or options to
mitigate the variability of the forecasted future purchases and sales of these
U.S. Dollar investments. The combination of the purchase and sale of the
U.S. Dollar investment and the hedging instrument has the effect of partially
offsetting the year-over-year foreign currency translation impact on net
earnings in the period the investments are sold. Hedges of available-for-sale
investments are accounted for as cash flow hedges.
Refer to Note 6 — Fair Value Measurements and Note 17 — Risk
Management and Derivatives in the accompanying Notes to the Consolidated
Financial Statements for additional description of how the above financial
instruments are valued and recorded as well as the fair value of outstanding
derivatives at each reported period end.
We estimate the combination of translation of foreign currency-denominated
profits from our international businesses and the year-over-year change in
foreign currency related gains and losses included in Other (income) expense,
net had an unfavorable impact of approximately $73 million and $139 million
on our Income before income taxes for the years ended May 31, 2015 and
2014, respectively.
Net Investments in Foreign Subsidiaries
We are also exposed to the impact of foreign exchange fluctuations on our
investments in wholly-owned foreign subsidiaries denominated in a currency
other than the U.S. Dollar, which could adversely impact the U.S. Dollar value
of these investments and therefore the value of future repatriated earnings.
We have, in the past, hedged and may, in the future, hedge net investment
positions in certain foreign subsidiaries to mitigate the effects of foreign
exchange fluctuations on these net investments. These hedges are
accounted for in accordance with the accounting standards for net
investment hedges. There were no outstanding net investment hedges as of
May 31, 2015 and 2014. There were no cash flows from net investment
hedge settlements for the years ended May 31, 2015 and 2014.
Liquidity and Capital Resources
Cash Flow Activity
Cash provided by operations was $4,680 million for fiscal 2015 compared to
$3,013 million for fiscal 2014. Our primary source of operating cash flow for
fiscal 2015 was Net income of $3,273 million. Our fiscal 2015 change in
working capital was a net cash inflow of $256 million as compared to a net
cash outflow of $488 million for fiscal 2014. Our investments in working
capital decreased due to increases in Accrued liabilities, primarily resulting
from the receipt of $968 million of cash collateral from counterparties as a
result of hedging activity. These amounts were partially offset by higher
inventory levels resulting from business growth and West Coast port delays in
North America, as well as lower Income taxes payable as a result of tax
payments made in fiscal 2015 following the U.S. Unilateral Advance Pricing
Agreement reached with the IRS in fiscal 2014.
Cash used by investing activities was $175 million for fiscal 2015, compared
to a $1,207 million use of cash for fiscal 2014. The primary driver of the
decrease in Cash used by investing activities was the net change in short-
term investments (including sales, maturities and purchases) from net
purchases to net sales/maturities. In fiscal 2015, there were $935 million of
net sales/maturities compared to $328 million of net purchases of short-term
investments in the same period of fiscal 2014. Additions to property, plant
and equipment were $963 million in fiscal 2015 as compared to $880 million
in fiscal 2014. The increase in Additions to property, plant and equipment
resulted from continued investments in infrastructure to support current and
future growth, primarily relating to expansion of our DTC operations as well as
supply chain and corporate initiatives.
In fiscal 2016, we plan to continue investing in our infrastructure to support
future growth, as well as expand our digital capabilities. We anticipate
investing approximately 4% of revenue, a portion of which will be used for the
continued expansion of our corporate facilities, new DTC stores and digital
capabilities.
Cash used by financing activities was $2,790 million for fiscal 2015 compared
to $2,914 million for fiscal 2014, a decrease of $124 million, as increased
dividends were more than offset by an increase in proceeds from the exercise
of stock options and the excess tax benefits from share-based payment
arrangements.
In fiscal 2015, we purchased 29.0 million shares of NIKE’s Class B Common
Stock for $2,534 million, an average price of $ 87.37. During fiscal 2013, we
completed the four-year, $5 billion share repurchase program approved by
our Board of Directors in September 2008. Under that program, we
purchased a total of 118.8 million shares at an average price of $42.08.
Subsequently, we began repurchases under a four-year, $8 billion program
approved by the Board in September 2012. As of the end of fiscal 2015, we
had repurchased 80.9 million shares at an average price of $73.55 for a total
cost of $5,950 million under this current program. We continue to expect
funding of share repurchases will come from operating cash flow, excess
cash and/or debt. The timing and the amount of shares purchased will be
dictated by our capital needs and stock market conditions.
Capital Resources
On April 23, 2013, we filed a shelf registration statement (the “Shelf”) with the
SEC which permits us to issue an unlimited amount of debt securities. The
Shelf expires on April 23, 2016. On April 23, 2013, we issued $1.0 billion of
senior notes with tranches maturing in 2023 and 2043. The 2023 senior notes
NIKE, INC. 2015 Annual Report and Notice of Annual Meeting 97
FORM 10-K