Nike 2015 Annual Report Download - page 71
Download and view the complete annual report
Please find page 71 of the 2015 Nike annual report below. You can navigate through the pages in the report by either clicking on the pages listed below, or by using the keyword search tool below to find specific information within the annual report.-
 1
1 -
2
-
3
-
4
-
5
-
6
-
7
-
8
-
9
-
10
-
11
-
12
-
13
-
14
-
15
-
16
-
17
-
18
-
19
-
20
-
21
-
22
-
23
-
24
-
25
-
26
-
27
-
28
-
29
-
30
-
31
-
32
-
33
-
34
-
35
-
36
-
37
-
38
-
39
-
40
-
41
-
42
-
43
-
44
-
45
-
46
-
47
-
48
-
49
-
50
-
51
-
52
-
53
-
54
-
55
-
56
-
57
-
58
-
59
-
60
-
 61
61 -
 62
62 -
 63
63 -
 64
64 -
 65
65 -
 66
66 -
 67
67 -
 68
68 -
 69
69 -
 70
70 -
 71
71 -
 72
72 -
 73
73 -
 74
74 -
 75
75 -
 76
76 -
 77
77 -
 78
78 -
 79
79 -
 80
80 -
 81
81 -
82
-
83
-
84
-
85
-
86
-
87
 |
 |

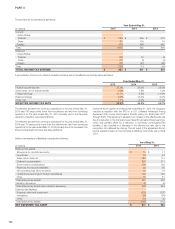
PART II
Year Ended May 31,
(In millions) 2015 2014 2013
REVENUES
North America $ 13,740 $ 12,299 $ 11,158
Western Europe 5,709 4,979 4,193
Central & Eastern Europe 1,417 1,387 1,229
Greater China 3,067 2,602 2,478
Japan 755 771 876
Emerging Markets 3,898 3,949 3,832
Global Brand Divisions 115 125 115
Total NIKE Brand 28,701 26,112 23,881
Converse 1,982 1,684 1,449
Corporate (82) 3 (17)
TOTAL NIKE CONSOLIDATED REVENUES $ 30,601 $ 27,799 $ 25,313
EARNINGS BEFORE INTEREST AND TAXES
North America $ 3,645 $ 3,077 $ 2,639
Western Europe 1,277 855 643
Central & Eastern Europe 247 279 234
Greater China 993 816 813
Japan 100 131 139
Emerging Markets 818 952 985
Global Brand Divisions (2,263) (1,993) (1,716)
Total NIKE Brand 4,817 4,117 3,737
Converse 517 496 425
Corporate (1,101) (1,036) (909)
Total NIKE Consolidated Earnings Before Interest and Taxes 4,233 3,577 3,253
Interest expense (income), net 28 33 (3)
TOTAL NIKE CONSOLIDATED EARNINGS BEFORE TAXES $ 4,205 $ 3,544 $ 3,256
ADDITIONS TO LONG-LIVED ASSETS
North America $ 208 $ 240 $ 132
Western Europe 216 120 75
Central & Eastern Europe 20 19 22
Greater China 69 63 52
Japan 15 9 7
Emerging Markets 37 55 50
Global Brand Divisions 225 225 270
Total NIKE Brand 790 731 608
Converse 69 30 20
Corporate 144 161 153
TOTAL ADDITIONS TO LONG-LIVED ASSETS $ 1,003 $ 922 $ 781
DEPRECIATION
North America $ 121 $ 109 $ 92
Western Europe 75 71 68
Central & Eastern Europe 12 11 9
Greater China 46 38 32
Japan 22 19 22
Emerging Markets 27 25 20
Global Brand Divisions 210 175 122
Total NIKE Brand 513 448 365
Converse 18 16 15
Corporate 75 54 38
TOTAL DEPRECIATION $ 606 $ 518 $ 418
132