Nike 2015 Annual Report Download - page 31
Download and view the complete annual report
Please find page 31 of the 2015 Nike annual report below. You can navigate through the pages in the report by either clicking on the pages listed below, or by using the keyword search tool below to find specific information within the annual report.-
 1
1 -
2
-
3
-
4
-
5
-
6
-
7
-
8
-
9
-
10
-
11
-
12
-
13
-
14
-
15
-
16
-
17
-
18
-
19
-
20
-
 21
21 -
 22
22 -
 23
23 -
 24
24 -
 25
25 -
 26
26 -
 27
27 -
 28
28 -
 29
29 -
 30
30 -
 31
31 -
 32
32 -
 33
33 -
 34
34 -
 35
35 -
 36
36 -
 37
37 -
 38
38 -
 39
39 -
 40
40 -
 41
41 -
42
-
43
-
44
-
45
-
46
-
47
-
48
-
49
-
50
-
51
-
52
-
53
-
54
-
55
-
56
-
57
-
58
-
59
-
60
-
61
-
62
-
63
-
64
-
65
-
66
-
67
-
68
-
69
-
70
-
71
-
72
-
73
-
74
-
75
-
76
-
77
-
78
-
79
-
80
-
81
-
82
-
83
-
84
-
85
-
86
-
87
 |
 |

PART II
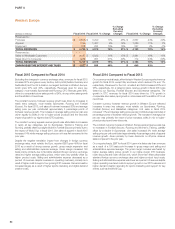
Greater China
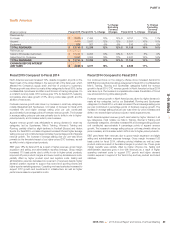
(Dollars in millions) Fiscal 2015 Fiscal 2014 % Change
% Change
Excluding
Currency
Changes Fiscal 2013 % Change
% Change
Excluding
Currency
Changes
Revenues by:
Footwear $ 2,016 $ 1,600 26% 28% $ 1,495 7% 5%
Apparel 925 876 6% 7% 844 4% 1%
Equipment 126 126 0% 1% 139 -9% -11%
TOTAL REVENUES $ 3,067 $ 2,602 18% 19% $ 2,478 5% 3%
Revenues by:
Sales to Wholesale Customers $ 2,233 $ 2,041 9% 11% $ 2,079 -2% -4%
Sales Direct to Consumer 834 561 49% 51% 399 41% 38%
TOTAL REVENUES $ 3,067 $ 2,602 18% 19% $ 2,478 5% 3%
EARNINGS BEFORE INTEREST AND TAXES $ 993 $ 816 22% $ 813 0%
Fiscal 2015 Compared to Fiscal 2014
Excluding changes in currency exchange rates, Greater China revenue
growth for fiscal 2015 was driven by higher revenues in our Sportswear,
Running and Basketball categories, partially offset by small declines in other
categories. Strong growth in DTC revenues reflected a 28% increase in
comparable store sales, strong online sales growth and the addition of new
stores.
Constant currency footwear revenue growth in fiscal 2015 was driven by
increased sales in our Sportswear, Running and Basketball categories,
partially offset by small declines in other categories. Unit sales of footwear
increased 20% for fiscal 2015 while increases in average selling price per pair
contributed approximately 8 percentage points of footwear revenue growth.
The increase in average selling price per pair was due primarily to an increase
in the proportion of revenues from our higher-priced DTC business.
Constant currency apparel revenue growth in fiscal 2015 was driven by
increases in the Sportswear, Running and Basketball categories, partially
offset by decreases in other categories, primarily Football (Soccer) and Men’s
Training. For fiscal 2015, unit sales of apparel increased 8% while changes in
average selling price per unit reduced apparel revenues by approximately 1
percentage point. The decline in average selling price per unit was due
primarily to shifts in mix to lower-priced products, partially offset by increased
revenues from our higher-priced DTC business.
On a reported basis, EBIT increased 22% for fiscal 2015 as higher revenues
and gross margin expansion more than offset higher selling and administrative
expense. Gross margin increased 270 basis points primarily due to higher
average selling prices and an increase in the proportion of revenues from our
higher-margin DTC business, partially offset by higher product costs. Selling
and administrative expense increased due to higher operating overhead to
support growth initiatives, primarily related to our DTC operations, as well as
higher demand creation spending, primarily for sports marketing.
Fiscal 2014 Compared to Fiscal 2013
Excluding changes in currency exchange rates, Greater China revenues
increased 3% in fiscal 2014, primarily driven by strong growth in our DTC
business, which represented 22% of total Greater China revenues for fiscal
2014. The growth in DTC revenues reflected a 20% increase in comparable
store sales, the addition of 30 net new stores, as well as online sales growth.
The increase in DTC revenues more than offset a 4% decrease in sales in our
wholesale business as we continued to manage the amount of product sold
into the market and worked with our wholesale partners to optimize product
mix for the consumer. On a category basis, higher revenues in our Basketball,
Sportswear and Running categories more than offset declines in Men’s
Training, Action Sports and Women’s Training.
Constant currency footwear revenue growth in fiscal 2014 was driven by
increased sales in our Basketball and Sportswear categories, partially offset
by declines in our Men’s Training, Running and Action Sports categories. Unit
sales for fiscal 2014 were flat compared to the prior year while average selling
price per pair contributed approximately 5 percentage points of footwear
revenue growth. The increase in average selling price per pair was driven by
favorable revenue mix resulting from a higher percent of sales from our higher-
priced DTC business, as well as shifts in mix to higher-priced products.
Constant currency apparel revenue growth for fiscal 2014 was driven by
increases in the Running, Sportswear and Basketball categories, partially
offset by decreases in Men’s Training and Women’s Training. Apparel unit
sales in fiscal 2014 were 1% higher while average selling price per unit was
flat.
Fiscal 2014 reported EBIT was flat compared to the prior year as reported
revenue and gross margin increases were offset by higher selling and
administrative expense as a percent of sales. Gross margin increased 150
basis points as higher average selling prices, growth in our higher-margin DTC
business and improved margins on closeout sales more than offset higher
product input costs and unfavorable product mix. Selling and administrative
expense increased due to higher operating overhead costs driven by
increased investments to support DTC growth and our new Greater China
headquarters in Shanghai, as well as higher demand creation spending.
92