Proctor and Gamble 2012 Annual Report Download - page 32
Download and view the complete annual report
Please find page 32 of the 2012 Proctor and Gamble annual report below. You can navigate through the pages in the report by either clicking on the pages listed below, or by using the keyword search tool below to find specific information within the annual report.-
 1
1 -
2
-
3
-
4
-
5
-
6
-
7
-
8
-
9
-
10
-
11
-
12
-
13
-
14
-
15
-
16
-
17
-
18
-
19
-
20
-
21
-
 22
22 -
 23
23 -
 24
24 -
 25
25 -
 26
26 -
 27
27 -
 28
28 -
 29
29 -
 30
30 -
 31
31 -
 32
32 -
 33
33 -
 34
34 -
 35
35 -
 36
36 -
 37
37 -
 38
38 -
 39
39 -
 40
40 -
 41
41 -
 42
42 -
43
-
44
-
45
-
46
-
47
-
48
-
49
-
50
-
51
-
52
-
53
-
54
-
55
-
56
-
57
-
58
-
59
-
60
-
61
-
62
-
63
-
64
-
65
-
66
-
67
-
68
-
69
-
70
-
71
-
72
-
73
-
74
-
75
-
76
-
77
-
78
-
79
-
80
-
81
-
82
-
83
-
84
-
85
-
86
-
87
-
88
-
89
-
90
-
91
-
92
 |
 |

30 The Procter & Gamble Company
generally higher than in developing markets for similar
products), the impacts of manufacturing savings projects and
to a lesser extent scale impacts (for costs that are fixed or
less variable in nature). The primary drivers of SG&A are
marketing-related costs and overhead costs. Marketing-
related costs are primarily variable in nature, although we do
achieve some level of scale benefit over time due to overall
growth and other marketing efficiencies. Overhead costs are
also variable in nature, but on a relative basis, less so than
marketing costs due to our ability to leverage our
organization and systems infrastructures to support business
growth. Accordingly, we generally experience more scale-
related impacts for these costs.
In February 2012, the Company announced a $10 billion
productivity and cost savings plan to reduce costs in the
areas of supply chain, research and development, marketing
and overhead expenses. The plan is designed to accelerate
cost reductions by streamlining management decision
making, manufacturing and other work processes in order to
help fund the Company's growth strategy. The Company
expects to incur approximately $3.5 billion in before-tax
restructuring costs over a four-year period as part of this
plan.
Net Sales
Fiscal year 2012 compared with fiscal year 2011
Net sales increased 3% to $83.7 billion in 2012 on unit
volume that was consistent with the prior year period.
Difficult macroeconomic conditions have caused a
slowdown in market growth, particularly in developed
markets. In addition, we have initiated a number of price
increases across each reportable segment, in large part to
recover the rising cost of commodities and currency
devaluations. These factors have negatively impacted
volume growth in 2012, but the price increases have led to
higher overall sales. Volume grew low single digits in
Beauty, Grooming, Health Care, and Baby Care and Family
Care. Fabric Care and Home Care volume decreased low
single digits. Volume grew mid-single digits in developing
regions and was down low single digits in developed
regions. The impact of overall global market growth was
partially offset by market share declines in certain
categories. Price increases added 4% to net sales, driven by
price increases across all business segments and regions,
primarily to help offset commodity costs and devaluing
currencies in certain developing markets. Mix reduced net
sales by 1% due to unfavorable geographic mix across the
Beauty, Grooming, Health Care, and Fabric Care and Home
Care reportable segments and unfavorable product mix.
Foreign exchange was neutral to net sales. Organic sales
growth was 3% driven by price increases.
Fiscal year 2011 compared with fiscal year 2010
Net sales increased 5% in 2011 to $81.1 billion on a 6%
increase in unit volume. Volume grew behind market and
share growth. Global market growth, in categories that we
compete, grew 3% on a constant currency basis. Volume
increased low single digits in developed regions and double
digits in developing regions. All geographic regions
contributed to volume growth, led by double-digit growth in
Asia, high single-digit growth in Latin America and mid-
single-digit growth in CEEMEA and Western Europe. All
five of the business segments contributed to volume growth
with high single-digit growth in the Baby Care and Family
Care and Fabric Care and Home Care segments, mid-single-
digit growth in the Beauty and Health Care segments, and a
low single-digit growth in the Grooming segment. Organic
volume, which excludes acquisitions and divestitures, was
up 5%. Mix reduced net sales by 2% due mainly to
disproportionate growth in developing regions and mid-tier
products, both of which have lower than Company average
selling prices, and declines in the premium-priced
professional salon and prestige categories. Pricing added
1% to net sales behind price increases to offset higher
commodity costs and foreign exchange. Foreign exchange
was neutral to net sales. Organic sales were up 4%, led by
high single-digit growth in the Baby Care and Family Care
segment, as well as mid-single-digit growth across the
Grooming and Health Care segments.
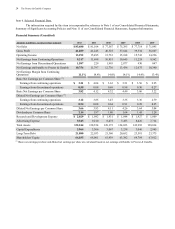
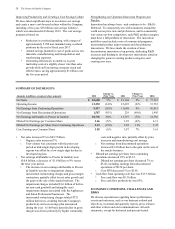
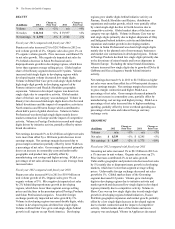
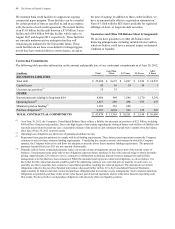
Operating Costs
Comparisons as a percentage of net sales; Years ended June 30 2012
Basis Point
Change 2011
Basis Point
Change 2010
Gross margin 49.3% (160) 50.9% (140) 52.3%
Selling, general and administrative expense 31.5% (30) 31.8% (20) 32.0%
Operating margin 15.9% (320) 19.1% (120) 20.3%
Earnings from continuing operations before income taxes 15.3% (320) 18.5% (70) 19.2%
Net earnings from continuing operations 11.1% (330) 14.4% 40 14.0%
Net earnings attributable to Procter & Gamble 12.9% (170) 14.6% (180) 16.4%