Proctor and Gamble 2012 Annual Report Download - page 58
Download and view the complete annual report
Please find page 58 of the 2012 Proctor and Gamble annual report below. You can navigate through the pages in the report by either clicking on the pages listed below, or by using the keyword search tool below to find specific information within the annual report.-
 1
1 -
2
-
3
-
4
-
5
-
6
-
7
-
8
-
9
-
10
-
11
-
12
-
13
-
14
-
15
-
16
-
17
-
18
-
19
-
20
-
21
-
22
-
23
-
24
-
25
-
26
-
27
-
28
-
29
-
30
-
31
-
32
-
33
-
34
-
35
-
36
-
37
-
38
-
39
-
40
-
41
-
42
-
43
-
44
-
45
-
46
-
47
-
 48
48 -
 49
49 -
 50
50 -
 51
51 -
 52
52 -
 53
53 -
 54
54 -
 55
55 -
 56
56 -
 57
57 -
 58
58 -
 59
59 -
 60
60 -
 61
61 -
 62
62 -
 63
63 -
 64
64 -
 65
65 -
 66
66 -
 67
67 -
 68
68 -
69
-
70
-
71
-
72
-
73
-
74
-
75
-
76
-
77
-
78
-
79
-
80
-
81
-
82
-
83
-
84
-
85
-
86
-
87
-
88
-
89
-
90
-
91
-
92
 |
 |
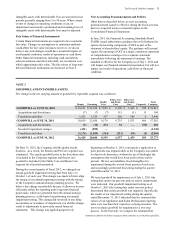
56 The Procter & Gamble Company
Amounts in millions of dollars except per share amounts or as otherwise specified.
value of each reporting unit to its carrying value. If the
estimated fair value of any reporting unit is less than its
carrying value, we perform a second step to determine the
implied fair value of the reporting unit's goodwill. The
second step of the impairment analysis requires a valuation
of a reporting unit's tangible and intangible assets and
liabilities in a manner similar to the allocation of purchase
price in a business combination. If the resulting implied fair
value of the reporting unit's goodwill is less than its carrying
value, that difference represents an impairment. The second
step of the goodwill impairment evaluations for the
Appliances and Salon Professional reporting units were
finalized during the quarter ended March 31, 2012. As a
result of our impairment testing, we recorded a non-cash
before and after tax impairment charge of $1.3 billion to
reduce the carrying amount of goodwill to estimated fair
value - $899 of the impairment related to Appliances and
$431 related to Salon Professional. As of June 30, 2012, the
carrying values of the Appliances and Salon Professional
goodwill were $586 and $397, respectively.
Our impairment testing for indefinite lived intangible assets
during the quarter ended December 31, 2011 also indicated a
decline in the fair value of our Koleston Perfect and Wella
trade name intangible assets below their respective carrying
values. This resulted in a non-cash before tax impairment
charge of $246 ($173 after tax) to reduce the carrying
amounts of these assets to their respective fair values. As of
June 30, 2012, the carrying values of the Koleston Perfect
and Wella trade names were $280 and $554, respectively. All
of the goodwill and indefinite-lived intangible asset
impairment charges are included in Corporate for segment
reporting.
To estimate the fair value of our reporting units and
indefinite-lived intangibles, we use a discounted cash flow
approach, which we believe is the most reliable indicator of
fair value of the businesses, and is most consistent with the
approach a marketplace participant would use. Under this
approach, we estimate the future cash flows of the respective
reporting units and indefinite-lived intangible assets and
discount those cash flows at a rate of return that reflects the
relative risk of each business.
The declines in the fair value of the Appliances and Salon
Professional reporting units and the underlying Koleston
Perfect and Wella trade name intangibles were driven by a
combination of similar competitive and economic factors,
which resulted in a reduction in the forecasted growth rates
and cash flows used to estimate fair value. These factors
include: (1) a more prolonged and deeper deterioration of the
macroeconomic environment than was previously expected
which, due to the more discretionary nature of the
Appliances and Salon Professional businesses, led to a
reduction in the overall market size in the short term and a
more significant and prolonged reduction in the expected
underlying market growth rates and resulting sales levels in
the longer term. This is particularly evident in Europe,
which is where we have historically generated a majority of
the Appliances and Salon Professional sales; (2) increasing
competitive levels of innovation in Salon Professional
negatively impacting our current and nearer-term projected
market share progress; and, (3) an increasing level of
competitive pricing activities negatively impacting pricing
levels and lowering overall category profitability. As a
result of these factors, we reduced our current and longer-
term sales and earnings forecasts for these businesses.
The goodwill and intangible asset valuations are dependent
on a number of significant estimates and assumptions,
including macroeconomic conditions, overall category
growth rates, competitive activities, cost containment and
margin expansion and Company business plans. We believe
these estimates and assumptions are reasonable. However,
actual events and results could differ substantially from
those used in our valuations. To the extent such factors
result in a failure to achieve the level of projected cash flows
used to estimate fair value, we may need to record additional
non-cash impairment charges in the future.
In addition to the impairment charge discussed above,
goodwill also decreased from June 30, 2011 primarily as a
result of currency translation across all reportable segments,
partially offset by the establishment of goodwill related to
the business combination with Teva Pharmaceuticals
Industries Ltd. in our Health Care reportable segment.
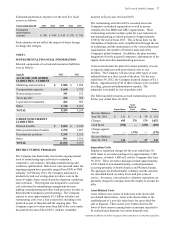
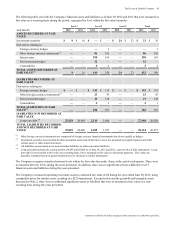
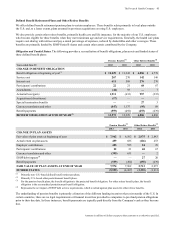
Identifiable intangible assets were comprised of:
2012 2011
June 30
Gross
Carrying
Amount
Accumulated
Amortization
Gross
Carrying
Amount
Accumulated
Amortization
INTANGIBLE ASSETS WITH DETERMINABLE
LIVES
Brands $ 3,297 $ 1,687 $ 3,392 $ 1,553
Patents and
technology 3,164 2,021 3,195 1,840
Customer
relationships 2,048 642 2,121 602
Other 352 218 335 217
TOTAL 8,861 4,568 9,043 4,212
INTANGIBLE ASSETS WITH INDEFINITE LIVES
Brands $26,695 $ — $27,789 $ —
TOTAL 35,556 4,568 36,832 4,212
The amortization of intangible assets was as follows:
Years ended June 30 2012 2011 2010
Intangible asset amortization $ 500 $ 546 $ 601