Proctor and Gamble 2012 Annual Report Download - page 77
Download and view the complete annual report
Please find page 77 of the 2012 Proctor and Gamble annual report below. You can navigate through the pages in the report by either clicking on the pages listed below, or by using the keyword search tool below to find specific information within the annual report.-
 1
1 -
2
-
3
-
4
-
5
-
6
-
7
-
8
-
9
-
10
-
11
-
12
-
13
-
14
-
15
-
16
-
17
-
18
-
19
-
20
-
21
-
22
-
23
-
24
-
25
-
26
-
27
-
28
-
29
-
30
-
31
-
32
-
33
-
34
-
35
-
36
-
37
-
38
-
39
-
40
-
41
-
42
-
43
-
44
-
45
-
46
-
47
-
48
-
49
-
50
-
51
-
52
-
53
-
54
-
55
-
56
-
57
-
58
-
59
-
60
-
61
-
62
-
63
-
64
-
65
-
66
-
 67
67 -
 68
68 -
 69
69 -
 70
70 -
 71
71 -
 72
72 -
 73
73 -
 74
74 -
 75
75 -
 76
76 -
 77
77 -
 78
78 -
 79
79 -
 80
80 -
 81
81 -
 82
82 -
 83
83 -
 84
84 -
 85
85 -
 86
86 -
 87
87 -
88
-
89
-
90
-
91
-
92
 |
 |

The Procter & Gamble Company 75
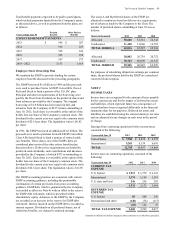
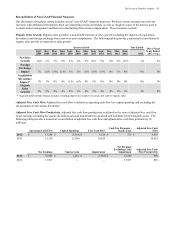
Amounts in millions of dollars except per share amounts or as otherwise specified.
Following is selected financial information included in net earnings from discontinued operations for the snacks and
pharmaceuticals businesses:
Net sales
Earnings from
discontinued
operations
Income tax
expense
Gain on sale of
discontinued
operations
Income tax
benefit/
(expense) on
sale
Net earnings
from
discontinued
operations
Snacks 2012 $ 1,440 $ 266 $ (96) $ 1,899 $ (482) $ 1,587
2011 1,455 322 (93) — — 229
2010 1,372 289 (84) — — 205
Pharmaceuticals 2012——————
2011——————
2010 751 306 (101) 2,632 (1,047) 1,790
Total 2012 1,440 266 (96) 1,899 (482) 1,587
2011 1,455 322 (93) — — 229
2010 2,123 595 (185) 2,632 (1,047) 1,995
The net gain on the sale of the pharmaceuticals business for the year ended June 30, 2010, also includes an after-tax gain on the
sale of the Actonel brand in Japan. This transaction occurred prior to the divestiture to Warner Chilcott.
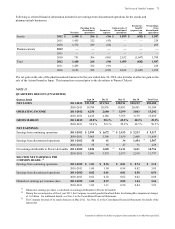
NOTE 13
QUARTERLY RESULTS (UNAUDITED)
Quarters Ended Sept 30 Dec 31 Mar 31 Jun 30 Total Year
NET SALES 2011-2012 $21,530 $21,744 $20,194 $20,212 $83,680
2010-2011 19,784 20,976 19,893 20,451 81,104
OPERATING INCOME 2011-2012 4,250 2,680 (2) 3,299 3,063 13,292
2010-2011 4,425 4,186 3,705 3,179 15,495
GROSS MARGIN 2011-2012 49.8% 50.1% 49.3% 48.1% 49.3%
2010-2011 52.0 % 52.1 % 50.8 % 48.5 % 50.9 %
NET EARNINGS:
Earnings from continuing operations 2011-2012 $ 2,999 $ 1,672 (2) $ 2,433 $ 2,213 $ 9,317
2010-2011 3,065 3,306 2,859 2,468 11,698
Earnings from discontinued operations 2011-2012 58 41 34 1,454 (3) 1,587
2010-2011 55 56 47 71 229
Net earnings attributable to Procter & Gamble 2011-2012 3,024 1,690 (2) 2,411 3,631 10,756
2010-2011 3,081 3,333 2,873 2,510 11,797
DILUTED NET EARNINGS PER
COMMON SHARE: (1)
Earnings from continuing operations 2011-2012 $ 1.01 $ 0.56 $ 0.81 $ 0.74 $ 3.12
2010-2011 1.00 1.09 0.94 0.82 3.85
Earnings from discontinued operations 2011-2012 0.02 0.01 0.01 0.50 0.54
2010-2011 0.02 0.02 0.02 0.02 0.08
Diluted net earnings per common share 2011-2012 1.03 0.57 0.82 1.24 3.66
2010-2011 1.02 1.11 0.96 0.84 3.93
(1) Diluted net earnings per share is calculated on earnings attributable to Procter & Gamble.
(2) During the second quarter of fiscal year 2012, the Company recorded goodwill and indefinite lived intangibles impairment charges
of 1.6 billion. For additional details, see Note 2 to the Consolidated Financial Statements.
(3) The Company divested of its snacks business in May 2012. See Note 12 to the Consolidated Financial Statements for details of the
transaction.