Proctor and Gamble 2012 Annual Report Download - page 34
Download and view the complete annual report
Please find page 34 of the 2012 Proctor and Gamble annual report below. You can navigate through the pages in the report by either clicking on the pages listed below, or by using the keyword search tool below to find specific information within the annual report.-
 1
1 -
2
-
3
-
4
-
5
-
6
-
7
-
8
-
9
-
10
-
11
-
12
-
13
-
14
-
15
-
16
-
17
-
18
-
19
-
20
-
21
-
22
-
23
-
 24
24 -
 25
25 -
 26
26 -
 27
27 -
 28
28 -
 29
29 -
 30
30 -
 31
31 -
 32
32 -
 33
33 -
 34
34 -
 35
35 -
 36
36 -
 37
37 -
 38
38 -
 39
39 -
 40
40 -
 41
41 -
 42
42 -
 43
43 -
 44
44 -
45
-
46
-
47
-
48
-
49
-
50
-
51
-
52
-
53
-
54
-
55
-
56
-
57
-
58
-
59
-
60
-
61
-
62
-
63
-
64
-
65
-
66
-
67
-
68
-
69
-
70
-
71
-
72
-
73
-
74
-
75
-
76
-
77
-
78
-
79
-
80
-
81
-
82
-
83
-
84
-
85
-
86
-
87
-
88
-
89
-
90
-
91
-
92
 |
 |
32 The Procter & Gamble Company
prior periods), which drove 410 basis points of the effective
tax rate difference. Net adjustments to tax balances for
uncertain tax positions in a number of jurisdictions resulted
in a benefit of approximately $535 million in 2011,
including a $252 million benefit from the settlement of U.S.
tax litigation primarily related to the valuation of technology
donations. The 2011 tax rate also benefited from the
geographic mix of current year sales and earnings, which
drove a 50-basis point reduction as an increased proportion
of earnings were generated in foreign markets with lower tax
rates versus the United States.
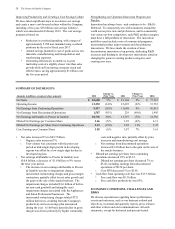
Net Earnings
Fiscal year 2012 compared with fiscal year 2011
Net earnings from continuing operations decreased 20% to
$9.3 billion in 2012 as an increase in net sales was more than
offset by the impact of impairment charges, incremental
restructuring charges and an increase in income taxes.
Operating margin declined 320 basis points due primarily to
a 190-basis point impact from goodwill and intangible
impairment charges in our Appliances and Salon
Professional businesses and an 85-basis point impact from
incremental restructuring charges. The impact of higher
commodity costs and negative product mix were largely
offset by higher pricing, manufacturing cost savings and
increased scale leverage.
Net earnings from discontinued operations increased $1.4
billion in 2012 due to the gain on the divestiture of the
snacks business.
Diluted net earnings per share decreased 7% from the prior
year to $3.66 in fiscal 2012 behind a decrease in net earnings
from continuing operations, partially offset by an increase in
net earnings from discontinued operations and a reduction in
shares outstanding. Diluted net earnings per share from
continuing operations in 2012 decreased 19% to $3.12.
Diluted net earnings per share from discontinued operations
increased $0.46 due to the gain on the divestiture of the
snacks business, partially offset by a decrease in the earnings
of the snacks business prior to the divestiture. The reduction
in the number of shares outstanding was driven by treasury
share repurchases of $4.0 billion, which were made under
our publicly announced share repurchase program.
Core EPS in 2012 decreased 1% to $3.85. Core EPS
represents diluted net earnings per share from continuing
operations excluding current-year impairment charges for
goodwill and indefinite lived intangible assets, current year
incremental restructuring charges due to the productivity and
cost savings plan, charges in both 2012 and 2011 for
European legal matters and a 2011 benefit from the
settlement of U.S. tax litigation primarily related to the
valuation of technology donations.
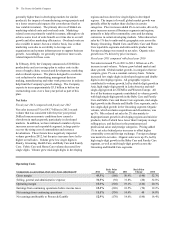
Fiscal year 2011 compared with fiscal year 2010
In 2011, net earnings from continuing operations were $11.7
billion, an increase of 8% versus the prior year due mainly to
net sales growth and a lower effective tax rate, partially
offset by operating margin contraction. Operating margin
decreased 120 basis points due to a decrease in gross margin,
partially offset by a decrease in SG&A spending as a
percentage of net sales. Gross margin declined behind
higher commodity costs, partially offset by manufacturing
cost savings. SG&A as a percentage of net sales declined
due to reduced foreign currency exchange costs and a
reduction in overhead spending as a percentage of net sales
due to productivity improvements, partially offset by
increased marketing investments.
In 2011, net earnings from discontinued operations
decreased $1.8 billion mainly due to the impact of the gain
on the divestiture of the global pharmaceuticals business in
2010.
Diluted net earnings per share from continuing operations in
2011 increased 11% to $3.85 behind higher net earnings
from continuing operations and the reduction in shares
outstanding. Diluted net earnings per share from
discontinued operations declined $0.56. Diluted net
earnings per share declined 4% to $3.93 driven by lower net
earnings from discontinued operations, partially offset by
higher net earnings from continuing operations and a
reduction in weighted average shares outstanding resulting
from share repurchase activity. The reduction in the number
of shares outstanding was driven by treasury share
repurchases of $7.0 billion, nearly all of which were made
under our publicly announced share repurchase program.
Core EPS increased 7% in 2011 to $3.87.
Venezuela Currency Impacts
Venezuela was determined to be a highly inflationary
economy under U.S. GAAP during fiscal 2010 and as a
result, the U.S. dollar is the functional currency for our
subsidiaries in Venezuela. Currency remeasurement
adjustments for non-dollar denominated monetary assets and
liabilities held by these subsidiaries and other transactional
foreign exchange gains and losses are reflected in earnings.
During fiscal 2010, the Venezuelan government devalued the
Bolivar Fuerte relative to the U.S. dollar. The
remeasurement of our local balance sheets in fiscal 2010 to
the new official exchange rate (4.3 Bolivares Fuertes to the
U.S. dollar) did not materially impact our results. This was
due to the relatively small non-dollar denominated net
monetary asset position in Venezuela. Our overall results in
Venezuela are reflected in our Consolidated Financial
Statements at the 4.3 rate, which is also expected to be
applicable to dividend repatriations.
Foreign currency transactions in Venezuela are subject to an
official government currency exchange rate. Transactions at
the official exchange rate are subject to CADIVI (Venezuela
government's Foreign Exchange Administrative
Commission). During recent years, in addition to the official
exchange rate used for qualifying dividends and imports of
goods and services, the Venezuelan government has had a
number of currency controls for companies operating in