Proctor and Gamble 2012 Annual Report Download - page 40
Download and view the complete annual report
Please find page 40 of the 2012 Proctor and Gamble annual report below. You can navigate through the pages in the report by either clicking on the pages listed below, or by using the keyword search tool below to find specific information within the annual report.-
 1
1 -
2
-
3
-
4
-
5
-
6
-
7
-
8
-
9
-
10
-
11
-
12
-
13
-
14
-
15
-
16
-
17
-
18
-
19
-
20
-
21
-
22
-
23
-
24
-
25
-
26
-
27
-
28
-
29
-
 30
30 -
 31
31 -
 32
32 -
 33
33 -
 34
34 -
 35
35 -
 36
36 -
 37
37 -
 38
38 -
 39
39 -
 40
40 -
 41
41 -
 42
42 -
 43
43 -
 44
44 -
 45
45 -
 46
46 -
 47
47 -
 48
48 -
 49
49 -
 50
50 -
51
-
52
-
53
-
54
-
55
-
56
-
57
-
58
-
59
-
60
-
61
-
62
-
63
-
64
-
65
-
66
-
67
-
68
-
69
-
70
-
71
-
72
-
73
-
74
-
75
-
76
-
77
-
78
-
79
-
80
-
81
-
82
-
83
-
84
-
85
-
86
-
87
-
88
-
89
-
90
-
91
-
92
 |
 |
38 The Procter & Gamble Company
In 2011, negative net sales in Corporate were down $101
million due to adjustments required to eliminate lower sales
of unconsolidated entities. Net income from continuing
operations increased $1.3 billion to $498 million. The
increase was due to net discrete adjustments to reverse
reserves for uncertain tax positions, lower interest expense, a
reduction in restructuring-type charges, divestiture gains and
prior-period charges for the taxation of certain future retiree
prescription drug subsidy payments in the U.S. Additional
discussion of the items impacting net income in Corporate
are included in the Results of Operations section above.
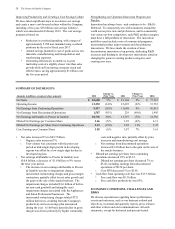
Productivity and Cost Savings Plan
In February 2012, the Company announced a $10 billion
productivity and cost savings plan to reduce costs and better
leverage scale in the areas of supply chain, research and
development, marketing and overheads. The program was
designed to accelerate cost reductions by streamlining
management decision making, manufacturing and other
work processes to fund the Company's growth strategy.
As part of this plan the Company expects to incur
approximately $3.5 billion in before-tax restructuring costs
over a four-year period (from fiscal 2012 through fiscal
2015). More than half of the costs will be incurred by the
end of fiscal 2013 and the remainder in fiscal years 2014 and
2015. Savings generated from the restructuring costs are
difficult to estimate, given the nature of the activities, the
corollary benefits achieved, the timing of the execution and
the degree of reinvestment. Overall, the costs are expected
to deliver approximately $2 billion in before-tax annual
savings. The before-tax savings in the current year are not
material due to the timing of the plan.
Restructuring accruals of $343 million as of June 30, 2012
are classified as current liabilities. Approximately 62% of
the restructuring charges incurred during 2012 either have
been or will be settled with cash. Consistent with our
historical policies for ongoing restructuring-type activities,
the resulting charges will be funded by and included within
Corporate for segment reporting.
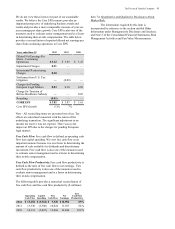
Refer to Note 3 in our Consolidated Financial Statements for
more details on the productivity and cost savings plan.
CASH FLOW, FINANCIAL CONDITION AND
LIQUIDITY
We believe our financial condition continues to be of high
quality, as evidenced by our ability to generate substantial
cash from operations and ready access to capital markets at
competitive rates.
Operating cash flow provides the primary source of funds to
finance operating needs and capital expenditures. Excess
operating cash is used first to fund shareholder dividends.
Other discretionary uses include acquisitions and share
repurchases to complement our portfolio of businesses,
brands and geographies. As necessary, we may supplement
operating cash flow with debt to fund these activities. The
overall cash position of the Company reflects our strong
business results and a global cash management strategy that
takes into account liquidity management, economic factors
and tax considerations.
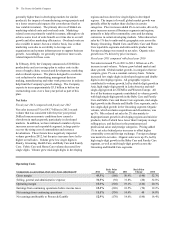
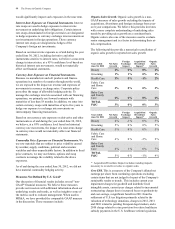
Operating Cash Flow
Fiscal year 2012 compared with fiscal year 2011
Operating cash flow was $13.3 billion in 2012, in line with
the prior year. Operating cash flows resulted primarily from
net earnings, adjusted for non-cash items (depreciation and
amortization, stock based compensation, asset impairments,
deferred income taxes, and gains on sale of businesses),
partially offset by working capital increases. Increased
accounts receivable used $427 million of cash to fund
growth. However, accounts receivable days sales
outstanding were down 2 days primarily due to the impact of
foreign exchange. Inventory generated $77 million of cash,
mainly due to an increase in inventory management
improvement efforts, partially offset by inventory to support
product initiatives and to build stock to support capacity
expansions and manufacturing sourcing changes. Inventory
days on hand declined by 10 days primarily due to inventory
management improvement efforts and the impact of foreign
exchange. Accounts payable, accrued and other liabilities
used $22 million of cash, due primarily to the payment of
fines related to violations of the European competition laws.
Cash flow from discontinued operations contributed
approximately $200 million to operating cash flow.
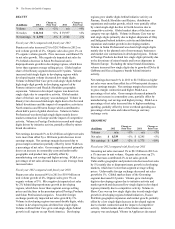
Fiscal year 2011 compared with fiscal year 2010
Operating cash flow was $13.3 billion in 2011, a 17%
decrease versus the prior year. Operating cash flow resulted
primarily from net earnings adjusted for non-cash items
(depreciation and amortization, stock-based compensation,
deferred income taxes and gain on the sale of businesses),
partially offset by an increase in working capital. The net of
accounts receivable, inventory and accounts payable
consumed $569 million of operating cash flow in 2011
mainly due to increases in inventories and accounts
receivables. Inventory consumed $501 million driven by
higher commodity costs, business growth and increased
stock levels in advance of initiatives and sourcing changes.
Inventory days on hand increased by five days due to the
impact of foreign exchange, higher commodity costs and
increased safety stock levels. Accounts receivable used
$426 million primarily to support business growth.
Accounts receivable days sales outstanding were up three
days due to timing of sales and the impact of foreign
exchange. Inventory and accounts receivable increases were
partially offset by accounts payable, accrued and other
liabilities, which increased by $358 million to support
business growth. Other operating assets and liabilities were
also a significant use of operating cash flow due primarily to
net reductions in reserves for uncertain tax positions and an
increase in the amount of value added taxes due from
various governmental authorities. In the prior year, working