Proctor and Gamble 2012 Annual Report Download - page 33
Download and view the complete annual report
Please find page 33 of the 2012 Proctor and Gamble annual report below. You can navigate through the pages in the report by either clicking on the pages listed below, or by using the keyword search tool below to find specific information within the annual report.-
 1
1 -
2
-
3
-
4
-
5
-
6
-
7
-
8
-
9
-
10
-
11
-
12
-
13
-
14
-
15
-
16
-
17
-
18
-
19
-
20
-
21
-
22
-
 23
23 -
 24
24 -
 25
25 -
 26
26 -
 27
27 -
 28
28 -
 29
29 -
 30
30 -
 31
31 -
 32
32 -
 33
33 -
 34
34 -
 35
35 -
 36
36 -
 37
37 -
 38
38 -
 39
39 -
 40
40 -
 41
41 -
 42
42 -
 43
43 -
44
-
45
-
46
-
47
-
48
-
49
-
50
-
51
-
52
-
53
-
54
-
55
-
56
-
57
-
58
-
59
-
60
-
61
-
62
-
63
-
64
-
65
-
66
-
67
-
68
-
69
-
70
-
71
-
72
-
73
-
74
-
75
-
76
-
77
-
78
-
79
-
80
-
81
-
82
-
83
-
84
-
85
-
86
-
87
-
88
-
89
-
90
-
91
-
92
 |
 |
The Procter & Gamble Company 31
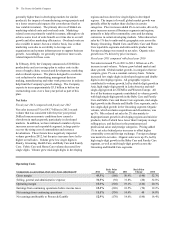
Fiscal year 2012 compared with fiscal year 2011
Gross margin contracted 160 basis points in 2012 to 49.3%
of net sales. The reduction in gross margin was driven
mainly by a 230-basis point impact from higher commodity
and energy costs. Gross margin was also negatively
impacted by 200 basis points from negative geographic and
product mix and by 30 basis points from the impact of
increased restructuring spending due to the productivity and
cost savings plan. The negative mix resulted from
disproportionate growth in developing regions, as
developing regions have lower relative gross margins than
developed regions. These impacts were partially offset by a
200-basis point impact from increased pricing and a 140-
basis point impact from manufacturing cost savings.
Total SG&A increased 3% to $26.4 billion in 2012, driven
by higher marketing spending to support initiative activity
and a $510 million increase in restructuring spending from
our productivity and cost savings plan, partially offset by a
reduction in competition law fines (see Item 3 of this Form
10-K and Note 10 of our Consolidated Financial Statements,
Commitments and Contingencies), which were $303 million
in the prior year compared to $75 million in the current year.
SG&A as a percentage of net sales decreased 30 basis points
to 31.5%, as reduced competition law fines and the impact
of increased scale leverage on marketing and overhead costs
from higher sales were partially offset by 60 basis points of
incremental restructuring costs.
We incurred impairment charges of $1.6 billion ($1.5 billion
after tax) in 2012 related to the carrying values of goodwill
in our Appliances and Salon Professional businesses and our
Koleston Perfect and Wella indefinite lived intangible assets,
which are part of our Salon Professional business. See Note
2 of our Consolidated Financial Statements for more details,
including factors leading to the impairment charges. Since
goodwill is included in Corporate for internal management
and segment reporting, the goodwill impairment charges are
included in the Corporate segment. The indefinite lived
intangible asset impairments are also included in the
Corporate segment for management and segment reporting.
Fiscal year 2011 compared with fiscal year 2010
Gross margin contracted 140 basis points in 2011 to 50.9%
of net sales. The reduction in gross margin was driven
mainly by a 225-basis point increase in commodity and
energy costs, along with negative product mix from
disproportionate growth in developing regions and mid-tier
products. These impacts were partially offset by
manufacturing cost savings and the favorable impact of
volume scale leverage.
Total SG&A increased 4% to $25.8 billion in 2011 behind
higher marketing and overhead spending, which was
partially offset by the impact of lower foreign currency
exchange costs. SG&A as a percentage of net sales
decreased 20 basis points to 31.8% due to a reduction in
overhead and other operating expenses as a percentage of net
sales, partially offset by increased marketing investments.
Marketing spending as a percentage of net sales increased 60
basis points due to additional marketing investments to
support innovation and expansion plans. Overhead spending
as a percentage of net sales decreased 50 basis points due to
sales leverage, partially offset by added spending to support
growth. Other operating expenses as a percentage of net
sales decreased 30 basis points mainly due to a decrease in
Venezuela-related foreign currency exchange costs of $548
million (see further discussion below in "Venezuela
Currency Impacts"). Charges for competition law fines
increased to $303 million versus the prior year charge of
$283 million.
Non-Operating Items
Fiscal year 2012 compared with fiscal year 2011
Interest expense decreased 7% in 2012 to $769 million, due
to lower interest rates on floating rate debt and a decrease in
average debt outstanding. Other non-operating income, net
primarily includes divestiture gains, interest and investment
income. Other non-operating income decreased $71 million
to $262 million in 2012 mainly behind the impact of minor
brand divestitures. A divestiture gain from the sale of our
PUR water filtration brand in the current year was less than
the Zest and Infasil divestiture gains in the prior year.
Fiscal year 2011 compared with fiscal year 2010
In 2011, interest expense decreased 12% to $831 million due
primarily to a reduction in interest rates on floating rate debt
partially offset by an increase in debt outstanding. Other
non-operating income was a net benefit of $333 million in
2011 versus $82 million in 2010. This $251 million increase
was primarily due to the impact of gains on divestitures in
2011 (Zest brand in North America and Infasil brand in
Western Europe) and incremental costs in the 2010
associated with exercising the call option on an outstanding
bond, partially offset by a gain due to the acquisition of
MDVIP in 2010.
Income Taxes
Fiscal year 2012 compared with fiscal year 2011
The effective tax rate on continuing operations increased 510
basis points to 27.1% in 2012 primarily due to a 250-basis
point impact from the non-deductibility of impairment
charges in the current year period and the net impact of
favorable discrete adjustments related to uncertain income
tax positions, which drove 250 basis points of the tax rate
difference. The net benefit on the current year was $165
million, which netted to 130 basis points, versus 380 basis
points of net benefits in the prior year.
Fiscal year 2011 compared with fiscal year 2010
In 2011, the effective tax rate on continuing operations
decreased 500 basis points to 22.0%. This was primarily
driven by net favorable discrete adjustments (primarily
driven by favorable audit and litigation settlements for
uncertain tax positions in multiple jurisdictions relating to