Proctor and Gamble 2012 Annual Report Download - page 38
Download and view the complete annual report
Please find page 38 of the 2012 Proctor and Gamble annual report below. You can navigate through the pages in the report by either clicking on the pages listed below, or by using the keyword search tool below to find specific information within the annual report.-
 1
1 -
2
-
3
-
4
-
5
-
6
-
7
-
8
-
9
-
10
-
11
-
12
-
13
-
14
-
15
-
16
-
17
-
18
-
19
-
20
-
21
-
22
-
23
-
24
-
25
-
26
-
27
-
 28
28 -
 29
29 -
 30
30 -
 31
31 -
 32
32 -
 33
33 -
 34
34 -
 35
35 -
 36
36 -
 37
37 -
 38
38 -
 39
39 -
 40
40 -
 41
41 -
 42
42 -
 43
43 -
 44
44 -
 45
45 -
 46
46 -
 47
47 -
 48
48 -
49
-
50
-
51
-
52
-
53
-
54
-
55
-
56
-
57
-
58
-
59
-
60
-
61
-
62
-
63
-
64
-
65
-
66
-
67
-
68
-
69
-
70
-
71
-
72
-
73
-
74
-
75
-
76
-
77
-
78
-
79
-
80
-
81
-
82
-
83
-
84
-
85
-
86
-
87
-
88
-
89
-
90
-
91
-
92
 |
 |

36 The Procter & Gamble Company
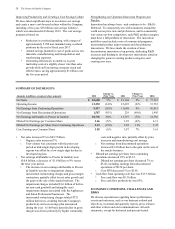
Net earnings decreased 3% to $1.8 billion as higher net sales
were more than offset by a 130-basis point decrease in net
earnings margin. Net earnings margin decreased due to
lower gross margin, higher SG&A as a percentage of net
sales and a higher effective tax rate. Gross margin declined
due to higher commodity costs and unfavorable mix due to
disproportionate growth in developing regions, partially
offset by manufacturing cost savings. SG&A as a
percentage of net sales increased behind higher marketing
spending to support growth, partially offset by lower foreign
currency exchange costs. The tax rate increase was due to a
shift in the geographic mix of earnings to countries with
higher statutory tax rates.
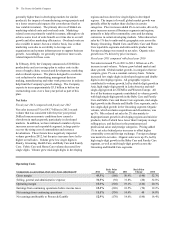
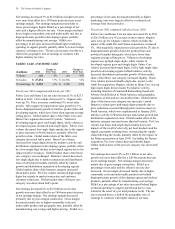
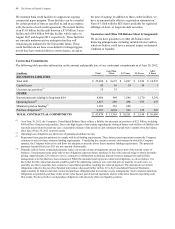
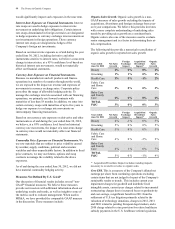
FABRIC CARE AND HOME CARE
($ millions) 2012
Change vs.
Prior Year 2011
Change vs.
Prior Year
Volume n/a -1% n/a +6%
Net sales $ 27,254 +3% $ 26,536 +4%
Net earnings $ 2,915 -6% $ 3,109 -12%
Fiscal year 2012 compared with fiscal year 2011
Fabric Care and Home Care net sales increased 3% to $27.3
billion in 2012. Unit volume decreased 1%. Organic sales
were up 3%. Price increases contributed 5% to net sales
growth. Mix negatively impacted net sales growth by 1%
due to disproportionate growth of mid-tier product lines and
developing regions, which have lower than segment average
selling prices. Global market share of the Fabric Care and
Home Care segment decreased 0.3 points. Volume in
developing regions grew mid-single digits, while volume in
developed regions decreased mid-single digits. Fabric Care
volume decreased low single digits mainly due to the impact
of price increases in North America, partially offset by
growth in Asia. Global market share of the fabric care
category decreased half a point. Home Care volume
increased low single digits driven by initiative activity and
distribution expansion in developing regions, partially offset
by a low-single-digit decline in developed regions due to the
impact of price increases. Global market share of the home
care category was unchanged. Batteries volume decreased
low single digits due to market contraction and distribution
losses in developed markets, partially offset by market
growth and distribution expansion in developing regions.
Global market share of the batteries category increased
about half a point. Pet Care volume decreased high single
digits due mainly to market contraction and customer
inventory reductions. Global market share of the pet care
category was down about half a point.
Net earnings decreased 6% to $2.9 billion as net sales
growth was more than offset by an 100-basis point decrease
in net earnings margin. Net earnings margin decreased
primarily due to gross margin contraction. Gross margin
decreased mainly due to higher commodity costs and
unfavorable product and geographic mix, partially offset by
manufacturing cost savings and higher pricing. SG&A as a
percentage of net sales decreased nominally as higher
marketing costs were largely offset by overhead scale
leverage from increased sales.
Fiscal year 2011 compared with fiscal year 2010
Fabric Care and Home Care net sales increased 4% in 2011
to $26.5 billion on a 6% increase in unit volume. Organic
sales were up 2%. Organic volume, which excludes the
impact of the Ambi Pur and Natura acquisitions, increased
5%. Mix negatively impacted net sales growth by 2% due to
disproportionate growth of mid-tier product lines and
powdered laundry detergents, which have lower than
segment average selling prices. Volume in developing
regions was up high single digits, while volume in
developed regions grew mid-single digits. Fabric Care
volume increased mid-single digits, led by high single-digit
growth in developing regions behind initiative activity,
increased distribution and market growth. Global market
share of the fabric care category increased slightly. Home
Care volume increased double digits due, in part, to the
Ambi Pur acquisition. Organic volume in Home Care was up
high single digits driven mainly by initiative activity,
including launches of Gain hand dishwashing liquid and
Febreze Set & Refresh in North America, and geographic
expansion of dish and air care product lines. Global market
share of the home care category was up nearly 1 point.
Batteries volume grew mid-single digits primarily due to
price reductions executed through pack count increases in
North America, which were implemented in January 2010,
initiative activity in Western Europe and market growth and
distribution expansion in Asia. Global market share of the
batteries category increased more than half a point. Pet Care
volume was down mid-single digits mainly due to the
impacts of the recall of select dry pet food products and the
supply constraints resulting from restructuring the supply
chain following the recalls, partially offset by the impact of
the Natura acquisition in June 2010. Excluding the Natura
acquisition, Pet Care volume decreased double digits.
Global market share of the pet care category was down half
a point.
Net earnings decreased 12% to $3.1 billion as net sales
growth was more than offset by a 220-basis point decrease
in net earnings margin. Net earnings margin decreased
mainly due to gross margin contraction. SG&A as a
percentage of net sales and the effective tax rate also
increased. Gross margin decreased mainly due to higher
commodity costs and unfavorable product mix behind
disproportionate growth of developing regions and mid-tier
products, partially offset by manufacturing cost savings.
SG&A as a percentage of net sales increased behind higher
overhead spending to support growth and due to costs
related to the select dry pet food products recall. The tax
rate increased due to a shift in the geographic mix of
earnings to countries with higher statutory tax rates.