Proctor and Gamble 2012 Annual Report Download - page 47
Download and view the complete annual report
Please find page 47 of the 2012 Proctor and Gamble annual report below. You can navigate through the pages in the report by either clicking on the pages listed below, or by using the keyword search tool below to find specific information within the annual report.-
 1
1 -
2
-
3
-
4
-
5
-
6
-
7
-
8
-
9
-
10
-
11
-
12
-
13
-
14
-
15
-
16
-
17
-
18
-
19
-
20
-
21
-
22
-
23
-
24
-
25
-
26
-
27
-
28
-
29
-
30
-
31
-
32
-
33
-
34
-
35
-
36
-
 37
37 -
 38
38 -
 39
39 -
 40
40 -
 41
41 -
 42
42 -
 43
43 -
 44
44 -
 45
45 -
 46
46 -
 47
47 -
 48
48 -
 49
49 -
 50
50 -
 51
51 -
 52
52 -
 53
53 -
 54
54 -
 55
55 -
 56
56 -
 57
57 -
58
-
59
-
60
-
61
-
62
-
63
-
64
-
65
-
66
-
67
-
68
-
69
-
70
-
71
-
72
-
73
-
74
-
75
-
76
-
77
-
78
-
79
-
80
-
81
-
82
-
83
-
84
-
85
-
86
-
87
-
88
-
89
-
90
-
91
-
92
 |
 |

The Procter & Gamble Company 45
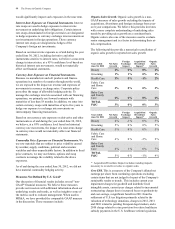
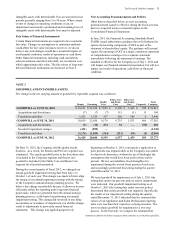
We do not view these items to be part of our sustainable
results. We believe the Core EPS measure provides an
important perspective of underlying business trends and
results and provides a more comparable measure of year-on-
year earnings per share growth. Core EPS is also one of the
measures used to evaluate senior management and is a factor
in determining their at-risk compensation. The table below
provides a reconciliation of reported diluted net earnings per
share from continuing operations to Core EPS:
Years ended June 30 2012 2011 2010
Diluted Net Earnings Per
Share - Continuing
Operations $ 3.12 $ 3.85 $ 3.47
Impairment Charges 0.51 ——
Incremental Restructuring
Charges 0.20 ——
Settlement from U.S. Tax
Litigation —(0.08) —
Charges for Pending
European Legal Matters 0.03 0.10 0.09
Charge for Taxation of
Retiree Healthcare Subsidy —— 0.05
Rounding (0.01) ——
CORE EPS $ 3.85 $ 3.87 $ 3.61
Core EPS Growth (1)% 7%
Note - All reconciling items are presented net of tax. Tax
effects are calculated consistent with the nature of the
underlying transaction. The significant adjustment to an
income tax reserve was tax expense. There was no tax
impact on EPS due to the charges for pending European
legal matters.
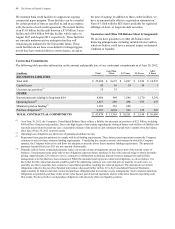
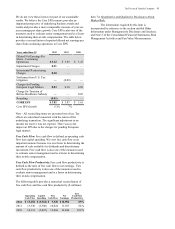
Free Cash Flow. Free cash flow is defined as operating cash
flow less capital spending. We view free cash flow as an
important measure because it is one factor in determining the
amount of cash available for dividends and discretionary
investment. Free cash flow is also one of the measures used
to evaluate senior management and is a factor in determining
their at-risk compensation.
Free Cash Flow Productivity. Free cash flow productivity is
defined as the ratio of free cash flow to net earnings. Free
cash flow productivity is also one of the measures used to
evaluate senior management and is a factor in determining
their at-risk compensation.
The following table provides a numerical reconciliation of
free cash flow and free cash flow productivity ($ millions):
Operating
Cash Flow
Capital
Spending
Free
Cash Flow
Net
Earnings
Free
Cash Flow
Productivity
2012 $ 13,284 $ (3,964) $ 9,320 $ 10,904 85%
2011 13,330 (3,306) 10,024 11,927 84 %
2010 16,131 (3,067) 13,064 12,846 102 %
Item 7A. Quantitative and Qualitative Disclosures About
Market Risk.
The information required by this item is
incorporated by reference to the section entitled Other
Information under Management's Disclosure and Analysis,
and Note 5 of the Consolidated Financial Statements, Risk
Management Activities and Fair Value Measurements.